May 2016 Market Update
Queens Home sales took a dip in April, which continued from March’s slight decline and also failed to outpace last year’s sales. Buyers are definitely out in full force, despite a mixed market in terms of both price growth and inventory levels, but it seems that we are seeing the same thing we saw last year in terms of Queens housing supply not being able to meet the growing buyer demand. Those searching for single family, multi family, and condo homes faced the tightest inventories as well as increases in price, while the coop market experienced more modest price gains. Overall, we are seeing a lot of buyer demand, especially in the more affordable areas of the borough. Desirable & popular neighborhoods are still in high demand as well, however, some properties on the high end of the market seemed to have flattened out a bit. Inventory is still very low, despite the Spring season being upon us, and as a result, we are still seeing strong sellers’ markets in most areas across in Queens. However, we are also seeing more neighborhoods with higher supply than demand as well.
Absorption Rate: 666 sales/per mo.
Current Available Inventory: 3,754
Month’s Supply: 5.6 Months
Last Month: 4.9 Months
Last year: 6.7 Months
*Month’s supply over 6 months is said to favor buyers, month’s supply below 6 months is said to favor sellers, and month’s supply of 5-6 months is said to be a balanced market.
Curious how much your home is worth? Find out now in 15 seconds
Interest Rates
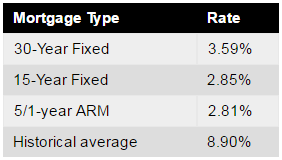
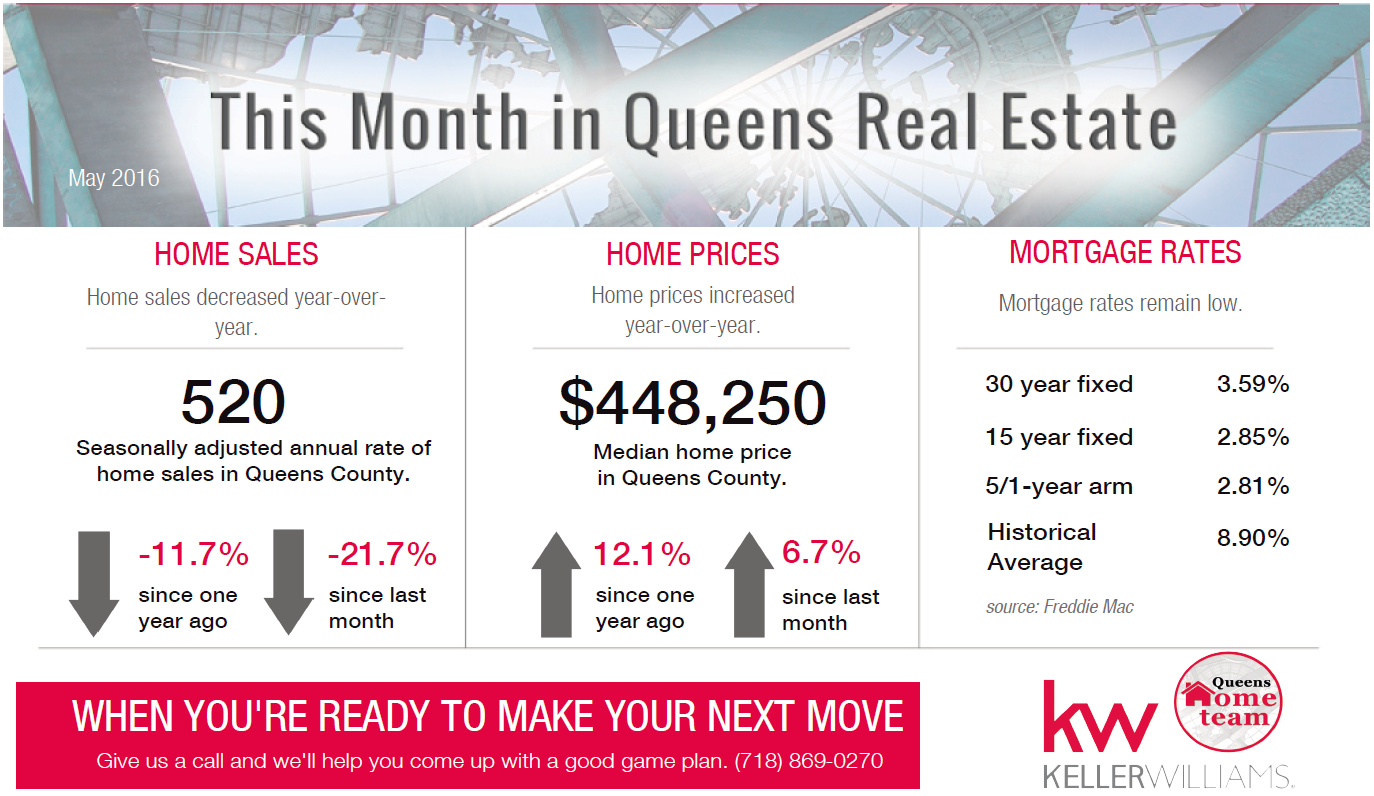
Interest rates ticked down slightly from the month prior and remain at historically low levels. The Federal Reserve refrained from raising interest rates in April. Rates will likely remain low, but may begin to trend upward as the next Federal Reserve meeting in June approaches.
Click Here for a Free Market Report of your Queens Neighborhood
Queens Home Sales
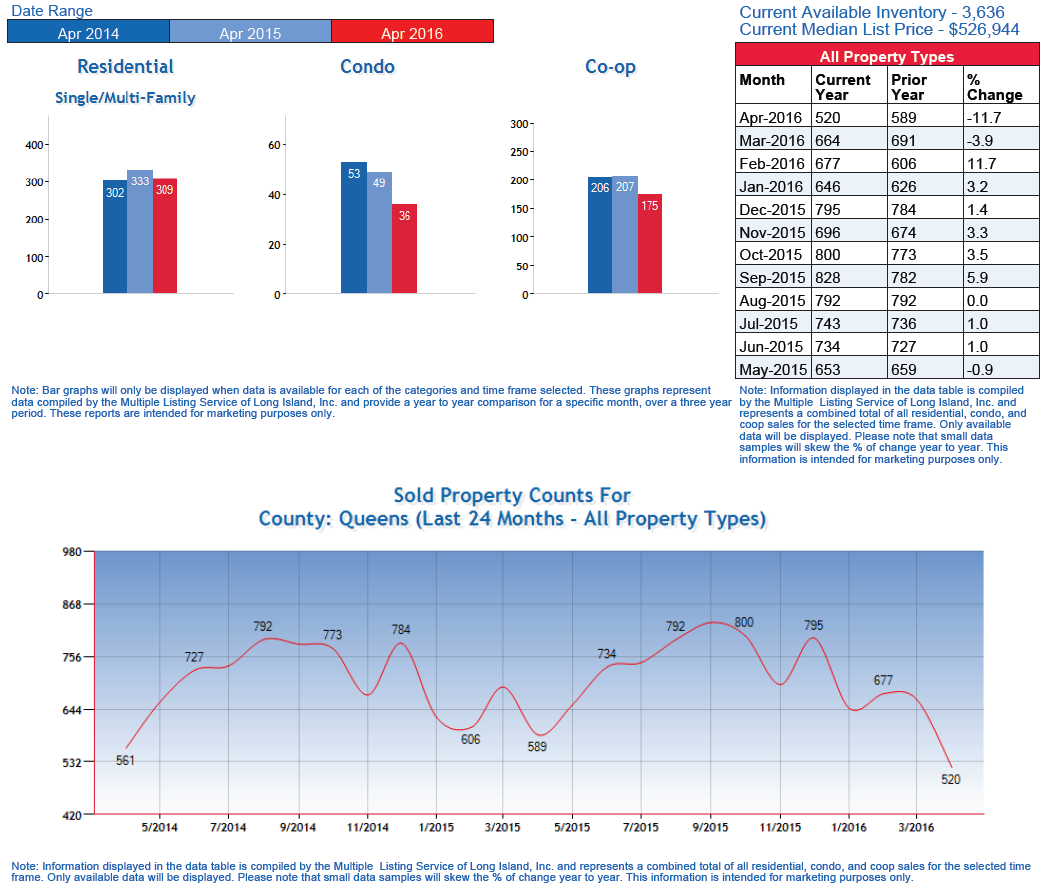
The Long Island Board of REALTORS® reported home sales at a seasonally adjusted annual rate of 520 homes during the month of April. This was an decrease of 21.7 percent from March, and a decrease of 11.7 percent from April of last year. Nationally, 2016 is projected to outpace 2015 home sales, we’ll have to wait and see how that prediction plays out locally in the Queens real estate market.
Specifically, Residential 1-3 family home sales were down 7.2%, Condo sales were down 26.5%, and Coop sales were down 15.5% compared to this time last year. Over the last 12 months, Queens home sales are up 1.3%.

Queens Home Prices
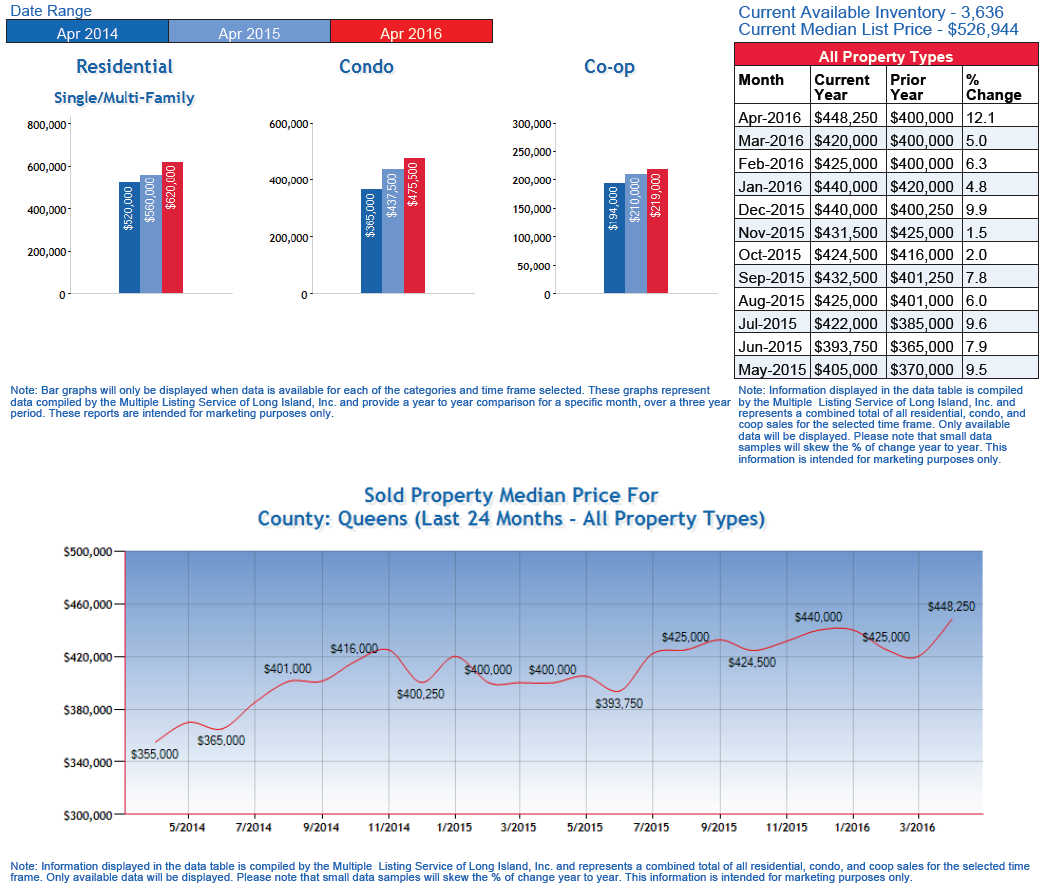
The median home price was $448,250 in April, which was up 6.7 percent from March and up 12.1 percent from last year.
Specifically, Residential 1-3 family home prices were up 10.7%, Condo prices were up 8.7%, and Coop prices were up 4.3% compared to April of last year. Over the last 12 months, Queens home prices are up 6.3% which is slightly above the 4-5% appreciation rate that most economists consider healthy.
Click Here for a List of Exclusive Homes for Sale in Queens NY
Queens Housing Inventory
There was a 5.6-month supply of housing inventory in April, up from 4.9 months in March. The total number of homes for sale in April increased by 6.6 percent to 3,754 homes county wide, but that was still 510 fewer listings than April of last year.
Specifically, there are currently 2,365 residential 1-3 family homes for sale, 373 Condos for sale, and 1,014 Coops for sale in Queens county. Ultimately, month’s supply is still pretty low and most markets still favor sellers. There are some neighborhoods where supply is outweighing demand and in those area we are seeing properties sit on the market longer. We are also seeing more demand in areas where affordability is higher so that’s another trend to watch out for in the remainder of 2016
Thinking of Selling? Click here for a Free Consultation

Blog Courtesy of George & Abigail Herrera w/the Queens Home Team at Keller Williams Realty Landmark II.
BUY: www.exclusivequeenshomes.com | SELL: www.queenshomeselling.com