


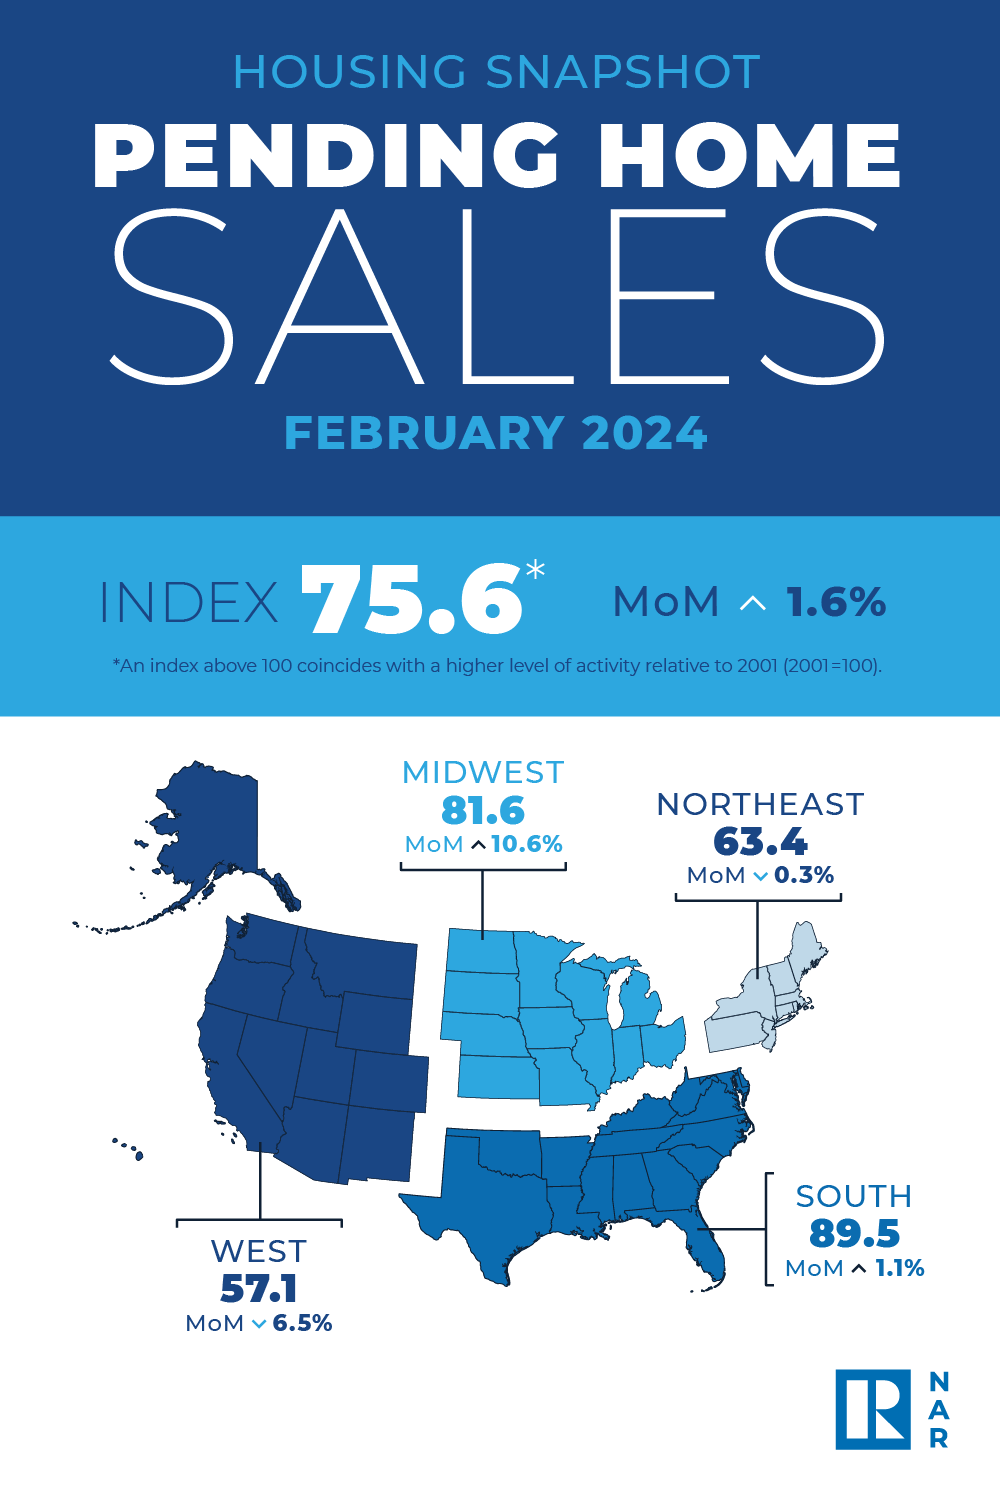
Pending home sales in February grew 1.6%, according to the National Association of Realtors®. The Midwest and South posted monthly gains in transactions while the Northeast and West recorded losses. All four U.S. regions registered year-over-year decreases.
The Pending Home Sales Index (PHSI)* – a forward-looking indicator of home sales based on contract signings – increased to 75.6 in February. Year over year, pending transactions were down 7.0%. An index of 100 is equal to the level of contract activity in 2001.
“While modest sales growth might not stir excitement, it shows slow and steady progress from the lows of late last year,” said NAR Chief Economist Lawrence Yun. “Ongoing job gains are clearly increasing demand along with more inventory.”
Pending Home Sales Regional Breakdown
The Northeast PHSI decreased 0.3% from last month to 63.4, a decline of 9.0% from February 2023. The Midwest index soared 10.6% to 81.6 in February, down 2.5% from one year ago.
The South PHSI rose 1.1% to 89.5 in February, falling 8.5% from the prior year. The West index fell 6.5% in February to 57.1, down 7.9% from February 2023.
“The high-cost regions in the Northeast and West experienced pullbacks due to affordability challenges,” added Yun. “Home prices rising faster than income growth is not healthy and adds challenges for first-time buyers.”
Yun further noted, “There will be a steady rise in inventory from recent growth in home building. Additionally, many sellers, who delayed listing in the past two years, will begin to put their homes on the market to move to a different home that better fits their new life circumstances – such as changes in family composition, jobs, commuting patterns and retirees wanting to be closer to their grandkids.”

Buyers must earn nearly twice as much as before the pandemic to afford the typical starter home, due to the one-two punch of high prices and mortgage rates. One sliver of hope: Affordability of starter homes is slowly improving after hitting a low point at the end of 2023.
Homebuyers must earn $75,849 annually to afford the typical U.S. starter home as of February, up 8.2% ($5,767) from a year earlier, according to a new report from Redfin (redfin.com), the technology-powered real estate brokerage. The monthly housing payment for the typical U.S. starter home was $1,896 in February, also up 8.2% from a year earlier.
The income necessary to buy starter homes is increasing from a year ago due to rising prices and mortgage rates: The typical starter home sold for $240,000 in February, up 3.4% year over year, and the average 30-year fixed mortgage rate was 6.78%, up from 6.26% a year earlier.
Starter homes are roughly half as affordable as they were before the pandemic. Americans needed to earn $40,465 annually to afford the typical U.S. starter home in February 2020, when the median sale price was $169,000 and the average mortgage rate was about 3.5%.
Americans earning the median U.S. income can still afford the typical starter home
Incomes are rising, but at less than half the rate of starter-home costs. The typical American household earns an estimated $84,072, up 5.5% from February 2023 (versus the 8.2% increase in income needed to buy a starter home). That means the typical household can afford the $75,849 median-priced starter home, but they have less money left over after housing payments than they used to.
Today, the median household income is just 11% higher than the income needed to buy a starter home. One year ago, the median household income was 14% higher than the income required to buy a starter home, and four years ago, just before the pandemic began, the median income was 63% higher.
Zooming out from starter homes to the overall market, a separate Redfin report found that a homebuyer must earn $114,000 to afford the typical U.S. home, roughly $30,000 more than the median U.S. household income.
It’s increasingly hard for lower-income families to buy a starter home
In the past, it was often true that people earning less than the median income could afford starter homes in much of the country; starter homes were considered an affordable option for first-time buyers.
Today, someone earning 80% of the median income—$67,258—could not afford the typical U.S. starter home. Before the pandemic real estate boom, someone earning 80% of the median income—roughly $53,000 in early 2020—could afford the typical starter home, which required an annual income of just over $40,000.
“The pandemic housing-market boom changed the definition of a starter home,” said Redfin Senior Economist Elijah de la Campa. “A decade ago, many people thought of a starter home as a small three-bedroom single-family house. Now that type of home could cost seven figures, especially in expensive parts of the country. The most affordable homes are much smaller and often require a lot of work to make them habitable—which makes them cost even more. Today’s most affordable homes are still hard for the average American to afford, let alone the average first-time buyer who tends to put less money down in exchange for higher monthly payments. Rising prices and mortgage rates are pushing buyers who earn more than the median income to buy starter homes, and often pushing buyers who earn less money out of the market.”
Another challenge for first-time buyers: They’re often competing with all-cash offers for limited inventory of starter homes. More than one-third (36.5%) of the nation’s starter homes were purchased in cash in February, near the highest level in a decade. It’s likely that many of those homes sold to real estate investors, who are turning them into rentals and thus removing them from the stock of for-sale starter homes. Others likely sold to repeat homebuyers using equity from a previous sale.
Starter homes are more affordable than they were last fall
While the income required to buy a starter home is up from a year ago, it’s down 8% ($6,524) from last October’s all-time high of $82,373. That’s because mortgage rates have come down from their recent high. Mortgage rates are sitting around 6.8%, down from a two-decade high of 7.8% in October 2023. Affordability should continue improving throughout 2024 as mortgage rates gradually decline further.
There are also a few other encouraging signs for first-time buyers:
- There are more starter homes to choose from. Active listings of starter homes rose 7% annually in February, the biggest increase in at least a decade. (The caveat is that the number of starter homes on the market fell to a record low in February 2023, which is part of the reason for the big year-over-year uptick.)
- In some metros, first-time buyers are able to negotiate prices down or get concessions from sellers because high costs are pushing down homebuying demand.
Metro-level* highlights: Starter homes, February 2024
*For the 50 most populous U.S. metros
- The income needed to afford a starter home is highest in California. A homebuyer needs to earn roughly $319,000 to buy the median-priced starter home in San Jose, $306,000 in San Francisco, and $247,000 in Anaheim.
- It’s lowest in the Rust Belt: Detroit ($22,000), Pittsburgh ($32,000) and St. Louis, MO ($37,000).
- The income needed to afford a starter home declined in just 1 metro area: Pittsburgh (-0.8% year over year to $32,000).
- It increased most in New Brunswick, NJ (17.5% to $126,000), Miami (16.7% to $104,000) and Montgomery County, PA (16% to $99,000).
To view the full report, including charts, tables and methodology, please visit: https://www.redfin.com/news/starter-home-affordability-february-2024


From buying and selling advice for consumers to money-making tips for Agents, our content, updated daily, has made Realty Times® a must-read, and see, for anyone involved in Real Estate.