


Existing-home sales receded in July, according to the National Association of Realtors®. Among the four major U.S. regions, sales grew in the West but faded in the Northeast, Midwest and South. All four regions registered year-over-year sales declines.
Total existing-home sales[1] – completed transactions that include single-family homes, townhomes, condominiums and co-ops – waned 2.2% from June to a seasonally adjusted annual rate of 4.07 million in July. Year-over-year, sales slumped 16.6% (down from 4.88 million in July 2022).
“Two factors are driving current sales activity – inventory availability and mortgage rates,” said NAR Chief Economist Lawrence Yun. “Unfortunately, both have been unfavorable to buyers.”
Total housing inventory[2] registered at the end of July was 1.11 million units, up 3.7% from June but down 14.6% from one year ago (1.3 million). Unsold inventory sits at a 3.3-month supply at the current sales pace, up from 3.1 months in June and 3.2 months in July 2022.
The median existing-home price[3] for all housing types in July was $406,700, an increase of 1.9% from July 2022 ($399,000). Prices rose in the Northeast, Midwest and South but were unchanged in the West.
“Most homeowners continue to enjoy large wealth gains from recent years with little concern about home price declines,” Yun said. “However, many renters are concerned as they’re facing growing affordability challenges because of high interest rates.”
REALTORS® Confidence Index
According to the REALTORS® Confidence Index, properties typically remained on the market for 20 days in July, up from 18 days in June and 14 days in July 2022. Seventy-four percent of homes sold in July were on the market for less than a month.
First-time buyers were responsible for 30% of sales in July, up from 27% in June and 29% in July 2022. NAR’s 2022 Profile of Home Buyers and Sellers – released in November 2022[4] – found that the annual share of first-time buyers was 26%, the lowest since NAR began tracking the data.
All-cash sales accounted for 26% of transactions in July, identical to June but up from 24% in July 2022.
Individual investors or second-home buyers, who make up many cash sales, purchased 16% of homes in July, down from 18% in June but up from 14% one year ago.
Distressed sales[5] – foreclosures and short sales – represented 1% of sales in July, virtually unchanged from last month and the previous year.
Mortgage Rates
According to Freddie Mac, the 30-year fixed-rate mortgage averaged 7.09% as of August 17. That’s up from 6.96% the prior week and 5.13% one year ago.
“Retreating mortgage rates will bring more buyers and sellers to the market and get Americans moving again,” Yun said.
Single-family and Condo/Co-op Sales
Single-family home sales slid to a seasonally adjusted annual rate of 3.65 million in July, down 1.9% from 3.72 million in June and 16.3% from the previous year. The median existing single-family home price was $412,300 in July, up 1.6% from July 2022.
Existing condominium and co-op sales recorded a seasonally adjusted annual rate of 420,000 units in July, down 4.5% from June and 19.2% from one year ago. The median existing condo price was $357,600 in July, up 4.5% from the previous year ($342,200).
Regional Breakdown
Existing-home sales in the Northeast descended 5.9% from June to an annual rate of 480,000 in July, down 23.8% from July 2022. The median price in the Northeast was $467,500, up 5.5% from one year ago.
In the Midwest, existing-home sales decreased by 3.0% from the prior month to an annual rate of 960,000 in July, dropping 20.0% from the previous year. The median price in the Midwest was $304,600, up 3.9% from July 2022.
Existing-home sales in the South retracted 2.6% from June to an annual rate of 1.86 million in July, a decrease of 14.3% from one year ago. The median price in the South was $366,200, up 1.7% from July 2022.
In the West, existing-home sales increased 2.7% from the previous month to an annual rate of 770,000 in July, down 12.5% from the prior year. The median price in the West was $610,500, unchanged from July 2022.


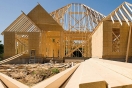
Redfin reports homebuyers are turning to newly built single-family homes as overall inventory sits at an all-time low
Newly built homes made up nearly one-third (31.4%) of single-family homes on the market nationwide in the second quarter, according to a new report from Redfin (redfin.com), the technology-powered real estate brokerage. That’s the highest share of any second quarter on record, with new construction keeping the housing market afloat amid the severe shortage of existing homes for sale.
The portion of new homes of all inventory is up from 30.3% a year earlier and nearly double the pre-pandemic share of about 17% in the second quarter of 2019.
The second quarter’s share is down from a near-record-high of 33.6% the previous quarter, but that’s a normal seasonal pattern, as the share of new homes tends to peak in the winter months.
New homes make up a near-record share of housing inventory for a few reasons:
- The pandemic-fueled homebuilding boom. Builders rushed to capitalize on the pandemic homebuying frenzy in 2021 and early 2022, driven by record-low mortgage rates and remote work.
- Lack of existing homes on the market. Builders aren’t constructing as many new single-family homes as they were at the height of the pandemic–but so few homeowners are putting their homes on the market that new homes still make up a huge share of available inventory. Total inventory dropped 15% year over year to an all-time low in June.
- Leftover inventory. Because elevated mortgage rates have slowed homebuying demand, builders haven’t yet offloaded all the new homes they completed over the last few years. Although buyers have made a dent in the glut of new-construction homes on the market over the last several months, there are still plenty of new homes on the market. The number of newly built single-family homes for sale was up 4.5% year over year in June, compared with an 18% drop for existing homes.
Homebuilders are benefiting from the scarcity of existing homes on the market
With inventory at a record low, many buyers are turning to new construction. But because overall demand is still relatively low, with high rates continuing to sideline many would-be homebuyers, some builders are lowering prices and offering perks to offload excess inventory.
For many homebuyers, new construction is a welcome option in today’s market–especially in the southern part of the country, where new homes tend to be more prevalent. That’s partly because new homes are often easier to find and partly because builders are more likely than individual homeowners to offer concessions; builders typically don’t have the option of pulling a home off the market if they’re unable to get the price they want.
“Builders are still building but homeowners aren’t selling, so new construction is the only option for many buyers,” said Shauna Pendleton, a Redfin Premier agent in Boise, ID, where new homes made up nearly 40% of single-family inventory in the second quarter. “A lot of buyers want to secure a home now because they’re worried prices are going to go back up, and new construction is more plentiful with perks that are hard to pass up. One builder is doing a promotion where buyers get anywhere from $15,000 to $25,000 worth of concessions. It was supposed to end in June, but they extended it through July, and now they’re extending it through August. That money can cover all of a buyer’s appliances with money left over for a mortgage-rate buydown.”
Metro-level highlights: Q2 2023
- Metros where new construction is most prevalent: Newly built homes made up more than half (52%) of single-family homes for sale in El Paso, TX, the biggest share of the metros in this analysis. It’s followed by Omaha, NE (46%), Raleigh, NC (42.1%), Oklahoma City (39%) and Boise (38%). New construction is typically prevalent in parts of the country with sprawling land and loose building codes.
- Metros where new construction is least prevalent: Newly built homes made up just 2.8% of single-family homes for sale in Honolulu, the smallest share of the metros in this analysis. Next come San Diego (3.3%), Pittsburgh, PA (3.3%), Oxnard, CA (3.7%), and Detroit (3.8%). New construction tends to be relatively uncommon in California because of limited land and strict regulations.
- Metros with the biggest upticks in newly built homes: New homes made up 33% of single-family inventory in Tulsa, OK, up from 20% a year earlier. That’s the biggest jump of the metros in this analysis. It’s followed by Richmond, VA (35%, up from 23%), Albany, NY (24%, up from 13%), Phoenix (26%, up from 15%) and Elgin, IL (25%, up from 15%).
- Metros with the biggest declines in newly built homes: Boise saw the biggest year-over-year decline by far, with new homes making up 38.3% of inventory, down from 49% a year earlier. It’s followed by Austin, TX (30.4%, down from 34.5%), Honolulu (2.8%, down from 6.4%), Allentown, PA (14.9%, down from 18.5%) and Houston (35.3%, down from 38.5%).
To view the full report, including charts and additional metro-level data, please visit: https://www.redfin.com/news/new-construction-homes-one-third-of-inventory
Agent Resource


From buying and selling advice for consumers to money-making tips for Agents, our content, updated daily, has made Realty Times® a must-read, and see, for anyone involved in Real Estate.