Highest Foreclosure States
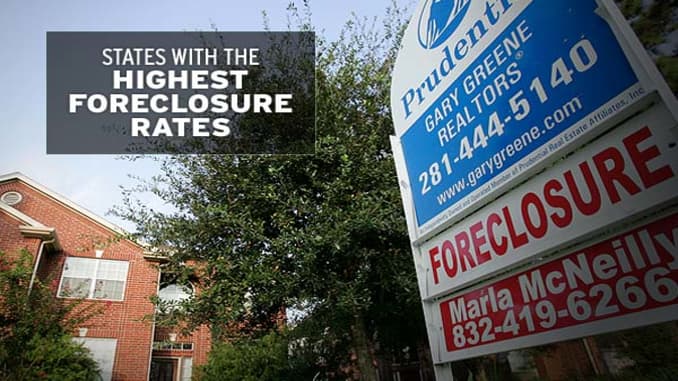
Foreclosure filings, defined as a default notice, auction sale notice, or bank repossession show a 4 percent decrease in July from June, and a 35 percent decrease from the same period a year ago, according to RealtyTrac’s July 2011 Foreclosure Market Report.
One in every 611 U.S. housing units, had a foreclosure filing during the month of July, RealtyTrac said.
“It appears that the foreclosure processing delays, combined with the smorgasbord of national and state-level foreclosure prevention efforts — including loan modifications, lender-borrower mediations and mortgage payment assistance for the unemployed — may be allowing more distressed homeowners to stave off foreclosure.” said James J. Saccacio, chief executive officer of RealtyTrac.
“Unfortunately, the falloff in foreclosures is not based on a robust recovery in the housing market but on short-term interventions and delays that will extend the current housing market woes into 2012 and beyond.”
Here are states with the 10 highest foreclosure rates in July 2011.
Updated August 11, 2011
10. Wisconsin

Rate: One in every 571 households
Properties with filings in July: 4,534
Change from June 2011: 43.34%
Change from July 2010: -8.11%
9. Illinois
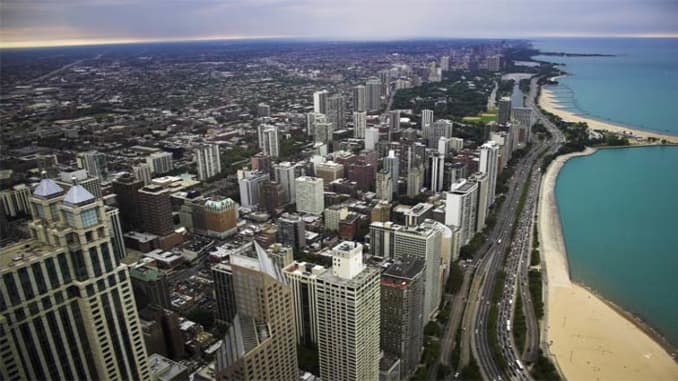
Rate: One in every 498 households
Properties with filings in July: 10,627
Change from June 2011: -3.51%
Change from July 2010: -45.79%
8. Idaho
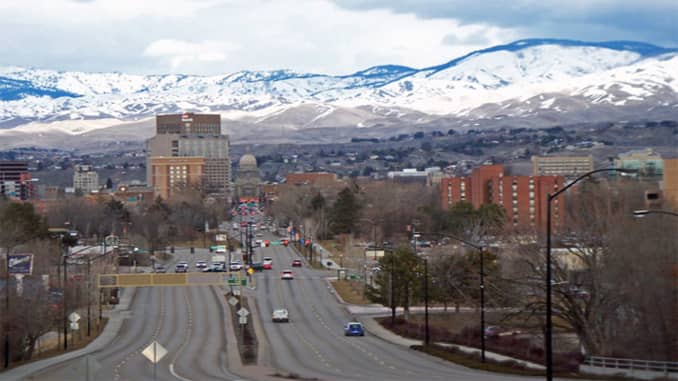
Rate: One in every 417 households
Properties with filings in July: 1,52
Change from June 2011: -17.49%
Change from July 2010: -42.02%
7. Michigan
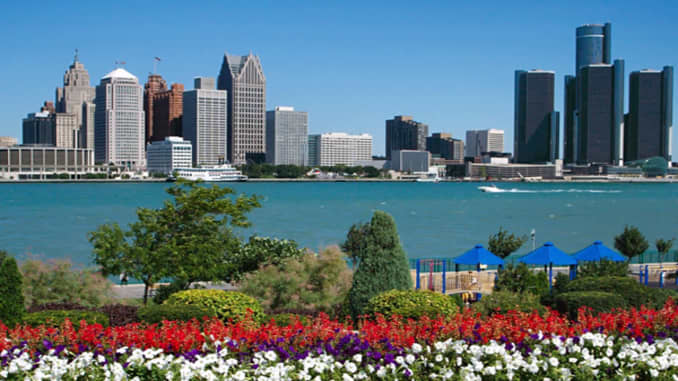
Rate: One in every 417 households
Properties with filings in July: 10,894
Change from May 2011: -15.67%
Change from June 2010: -42.15%
6. Florida
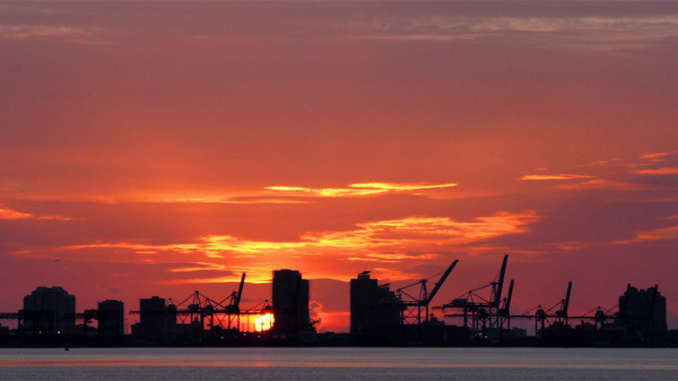
Rate: One in every 396 households
Properties with filings in July: 22,377
Change from June 2011: -5.86%
Change from July 2010: -56.60%
5. Utah

Rate: One in every 933 households
Properties with filings in July: 2,553
Change from May 2011: -21.13%
Change from June 2010: -34.50%
4. Georgia

Rate: One in every 355 households
Properties with filings in July: 11,461
Change from June 2011: 17.97%
Change from July 2010: -8.87%
3. Arizona

Rate: One in every 273 households
Properties with filings in July: 10,098
Change from June 2011: -24.91
Change from June 2010: -38.04
2. California
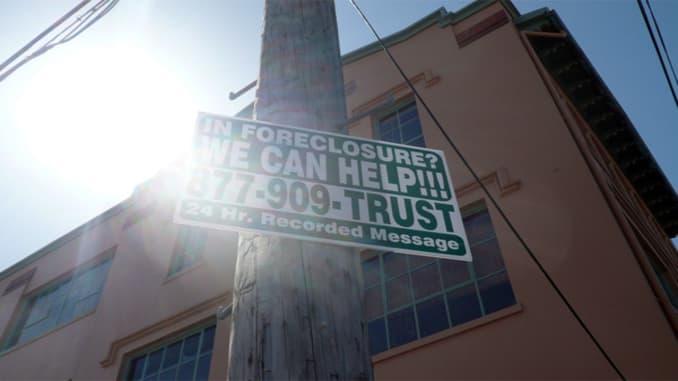
Rate: One in every 239 households
Properties with filings in July: 56,193
Change from June 2011: 3.89%
Change from July 2010: -16.02%
1. Nevada
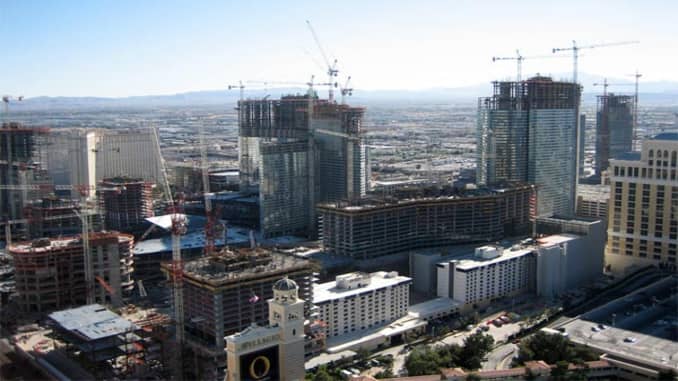
Rate: One in every 115 households
Properties with filings in July: 9,930
Change from June 2011: -0.77%
Change from July 2010: -27.66%