


Homebuyer Demand Index is ticking up as the spring home-selling season draws nearer. That hasn’t yet converted to a meaningful improvement in pending sales–but Redfin agents expect it will in the next few months.
Redfin’s Homebuyer Demand Index—a measure of requests for tours and other buying services from Redfin agents—rose 6% from a week earlier during the week ending January 28, according to a new report from Redfin (redfin.com), the technology-powered real estate brokerage. An additional measure of showings also signals tours have ticked up over the last week.
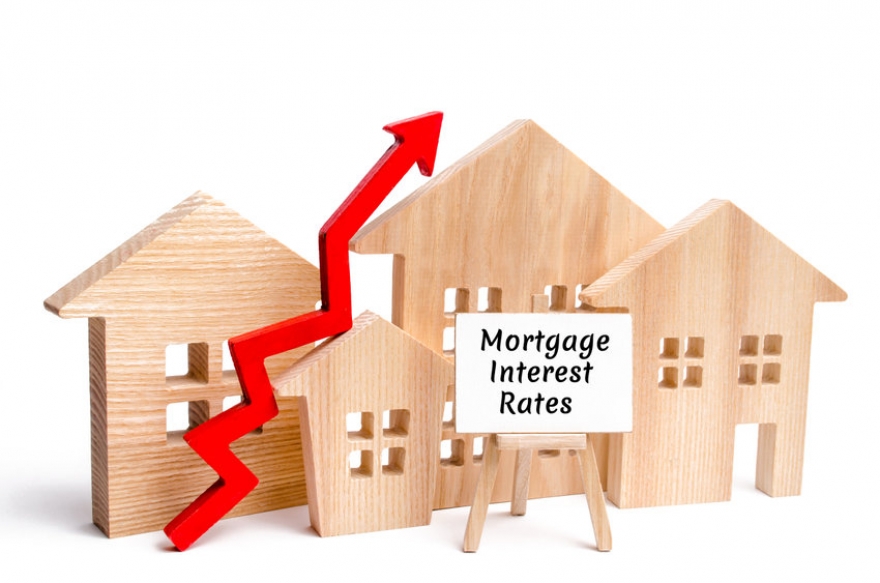
More buyers are touring homes because mortgage rates are holding steady below 7%, down from 8% this past October, and some buyers are worried prices will increase more if they wait longer. Sale prices rose 5.5% year over year during the four weeks ending January 28, the biggest increase in over a year.
But that earliest-stage demand hasn’t yet translated into home sales. Mortgage-purchase applications declined from a week earlier and pending sales posted their biggest year-over-year decline in four months, likely reflecting tepid early-stage demand during the middle of January. Home tours and other actions buyers typically take before applying for a mortgage was lower than expected in mid-January as daily average mortgage rates inched up from their December low point and severe weather kept many would-be buyers at home.
Redfin agents expect the increase in tours to convert into an improvement in pending sales over the next few months. That’s partly because of typical seasonality: Home listings and sales usually pick up as spring approaches.
“I thought declining mortgage rates and more inventory would cause the market to take off right at the start of the new year. But even though demand has picked up some, I’m not wowed,” said Hal Bennett, a Redfin Premier agent in the Seattle area. “Now I believe this year’s market will launch in the spring, once 6% rates are even more entrenched in buyers’ psyches and more homeowners list their houses.”
This week’s economic news suggests that mortgage rates are unlikely to meaningfully fall in the next few months. At its press conference on January 31, the Fed signaled they’re unlikely to cut interest rates in March, which will probably keep mortgage rates elevated near their current level into the spring, though Redfin economists still expect them to gradually decline by the end of the year.
Leading indicators
|
Indicators of homebuying demand and activity |
||||
|
Value (if applicable) |
Recent change |
Year-over-year change |
Source |
|
|
Daily average 30-year fixed mortgage rate |
6.75% (Jan. 31) |
Down from 6.95% a week earlier |
Up from 6.17% |
Mortgage News Daily |
|
Weekly average 30-year fixed mortgage rate |
6.69% (week ending Jan. 25) |
Up from 6.6% a week earlier, but near lowest level since May |
Up from 6.13% |
Freddie Mac |
|
Mortgage-purchase applications (seasonally adjusted) |
Down 11% from a week earlier; up 10% from a month earlier (as of week ending Jan. 26) |
Down 20% |
Mortgage Bankers Association |
|
|
Redfin Homebuyer Demand Index (seasonally adjusted) |
Down 3% from a month earlier (as of week ending Jan. 28) |
Down 17% |
Redfin Homebuyer Demand Index, a measure of requests for tours and other homebuying services from Redfin agents |
|
|
Google searches for “home for sale” |
Up 25% from a month earlier (as of Jan. 27) |
Down 16% |
Google Trends |
|
|
Touring activity |
Up 9% from the start of the year (as of Jan. 30) |
At this time last year, it was up 5% from the start of 2023 |
ShowingTime, a home touring technology company |
|
Key housing-market data
|
U.S. highlights: Four weeks ending January 28, 2024 Redfin’s national metrics include data from 400+ U.S. metro areas, and is based on homes listed and/or sold during the period. Weekly housing-market data goes back through 2015. Subject to revision. |
|||
|
Four weeks ending |
Year-over-year |
Notes |
|
|
Median sale price |
$361,245 |
5.5% |
Biggest increase since Oct. 2022 |
|
Median asking price |
$392,349 |
7% |
Biggest increase since Sept. 2022 |
|
Median monthly mortgage payment |
$2,595 at a 6.69% mortgage rate |
12.3% |
Down roughly $120 from all-time high set in October 2023, but up roughly $250 from the four weeks ending Dec. 31 |
|
Pending sales |
62,501 |
-8.5% |
Biggest decline since October 2023 |
|
New listings |
65,722 |
4.9% |
|
|
Active listings |
743,508 |
-3.8% |
|
|
Months of supply |
4.8 months |
+0.2 pts. |
4 to 5 months of supply is considered balanced, with a lower number indicating seller’s market conditions |
|
Share of homes off market in two weeks |
30% |
Up from 29% |
|
|
Median days on market |
47 |
-2 days |
|
|
Share of homes sold above list price |
22.8% |
Up from 21% |
|
|
Share of homes with a price drop |
5.2% |
+0.3 pts. |
|
|
Average sale-to-list price ratio |
98.2% |
+0.5 pts. |
|
|
Metro-level highlights: Four weeks ending January 28, 2024 Redfin’s metro-level data includes the 50 most populous U.S. metros. Select metros may be excluded from time to time to ensure data accuracy. |
|||
|
Metros with biggest year-over-year increases |
Metros with biggest year-over-year decreases |
Notes |
|
|
Median sale price |
Anaheim, CA (15.6%) Miami (14.7%) New Brunswick, NJ (13.3%) West Palm Beach, FL (12.9%) Detroit (11.8%) |
Austin, TX (-5.6%) San Antonio, TX (-2.1%) |
Declined in 2 metros |
|
Pending sales |
San Francisco (11.5%) San Jose, CA (10.9%) Anaheim, CA (1.7%) |
Portland, OR (-31.2%) San Antonio, TX (-31%) Denver (-30.6%) Nashville, TN (-18.7%) New Brunswick, NJ (-17.6%) |
Increased in 3 metros |
|
New listings |
Fort Lauderdale, FL (26.5%) Phoenix (23.1%) San Diego, CA (22.6%) Miami (22.3%) Minneapolis, MN (19.9%) |
Denver (-20.8%) Chicago (-18.7%) Atlanta (-15.9%) Portland, OR (-10.5%) Nashville, TN (-9.8%) |
Declined in 16 metros |
To view the full report, including charts, please visit:
https://www.redfin.com/news/housing-market-update-more-house-hunters-touring-homes

New construction has taken up a growing share of the for-sale housing pie because homebuilding has increased and the number of individual homeowners selling has decreased
Nationwide, 31.8% of U.S. single-family homes for sale in the fourth quarter were new construction, according to a new report from Redfin (redfin.com), the technology-powered real estate brokerage. That’s comparable with 31.9% a year earlier, which is the highest level of any fourth quarter on record.
Newly built homes are taking up a growing share of the for-sale housing pie for two primary reasons:
- Homebuilding has increased. Homebuilding has been on an upward trajectory since 2009 as builders have slowly climbed their way out of the hole caused by the Great Recession. Construction also jumped during the pandemic as builders responded to surging homebuyer demand fueled by record-low mortgage rates.
- The number of homeowners putting their houses on the market has decreased over the last year and a half. That’s because mortgage rates started rising in 2022 and jumped to a 23-year high in 2023, prompting many homeowners to stay put instead of selling and losing the rock-bottom rate they scored during the pandemic. While mortgage rates have fallen a bit in the last few months, this “lock-in effect” continues to hamper listings, which are higher than they were a year ago but remain far below pre-pandemic levels.
-
Homebuilders have been offering sizable concessions, including money for mortgage rate buydowns, to attract bidders and offload inventory. That has made it hard for some individual sellers of existing homes to compete for buyers.
“Newly built homes are selling quickly right now because builders are offering such good discounts,” said Heather Mahmood-Corley, a Redfin Premier real estate agent in Phoenix. “I recently had a buyer who wasn’t interested in a new construction home, but the builder offered such a good rate–5.25%–that they couldn’t afford not to take it. Another one of my buyers got a $10,000 credit for closing costs from a builder.”
While builders are offering discounts, they’ve also boosted prices, according to Christine Kooiker, a Redfin Premier real estate agent in Grand Rapids, MI.
“One of the builders in Grand Rapids that focuses on entry-level homes now has prices in the mid $300,000 range,” Kooiker said. “Not long ago, buyers could get a new construction home here for $250,000 or $300,000.”
Roughly two of every five (42%) new single-family homes that sold in 2022 went for $500,000 or more, up from under one-third (30%) in 2021 and 18% in 2020.
To view the full report, including a chart, please visit: https://www.redfin.com/news/new-construction-q4-2023
Agent Resource
|
||||||

What's New


From buying and selling advice for consumers to money-making tips for Agents, our content, updated daily, has made Realty Times® a must-read, and see, for anyone involved in Real Estate.