


HomesUSA.com Reports February Pace of Sales Slows, Average Price Ticks Higher
March 21, 2025 – Mortgage interest rates continued to put downward pressure on Houston new home sales last month. However, year-over-year new home sales in the Houston area are up double-digits – 11% from February 2024, according to the newest monthly Texas New Home Sales Report released today by HomesUSA.com and its founder and CEO, Ben Caballero, the nation's top-ranked real estate agent.
 The HomesUSA.com New Home Sales Report uses Multiple Listing Service data – the most comprehensive, current, and accurate information – from the Realtor Associations of Houston, North Texas, Austin, and San Antonio. All averages in the monthly report are based on three-month rolling averages to reduce short-term volatility and anomalies.
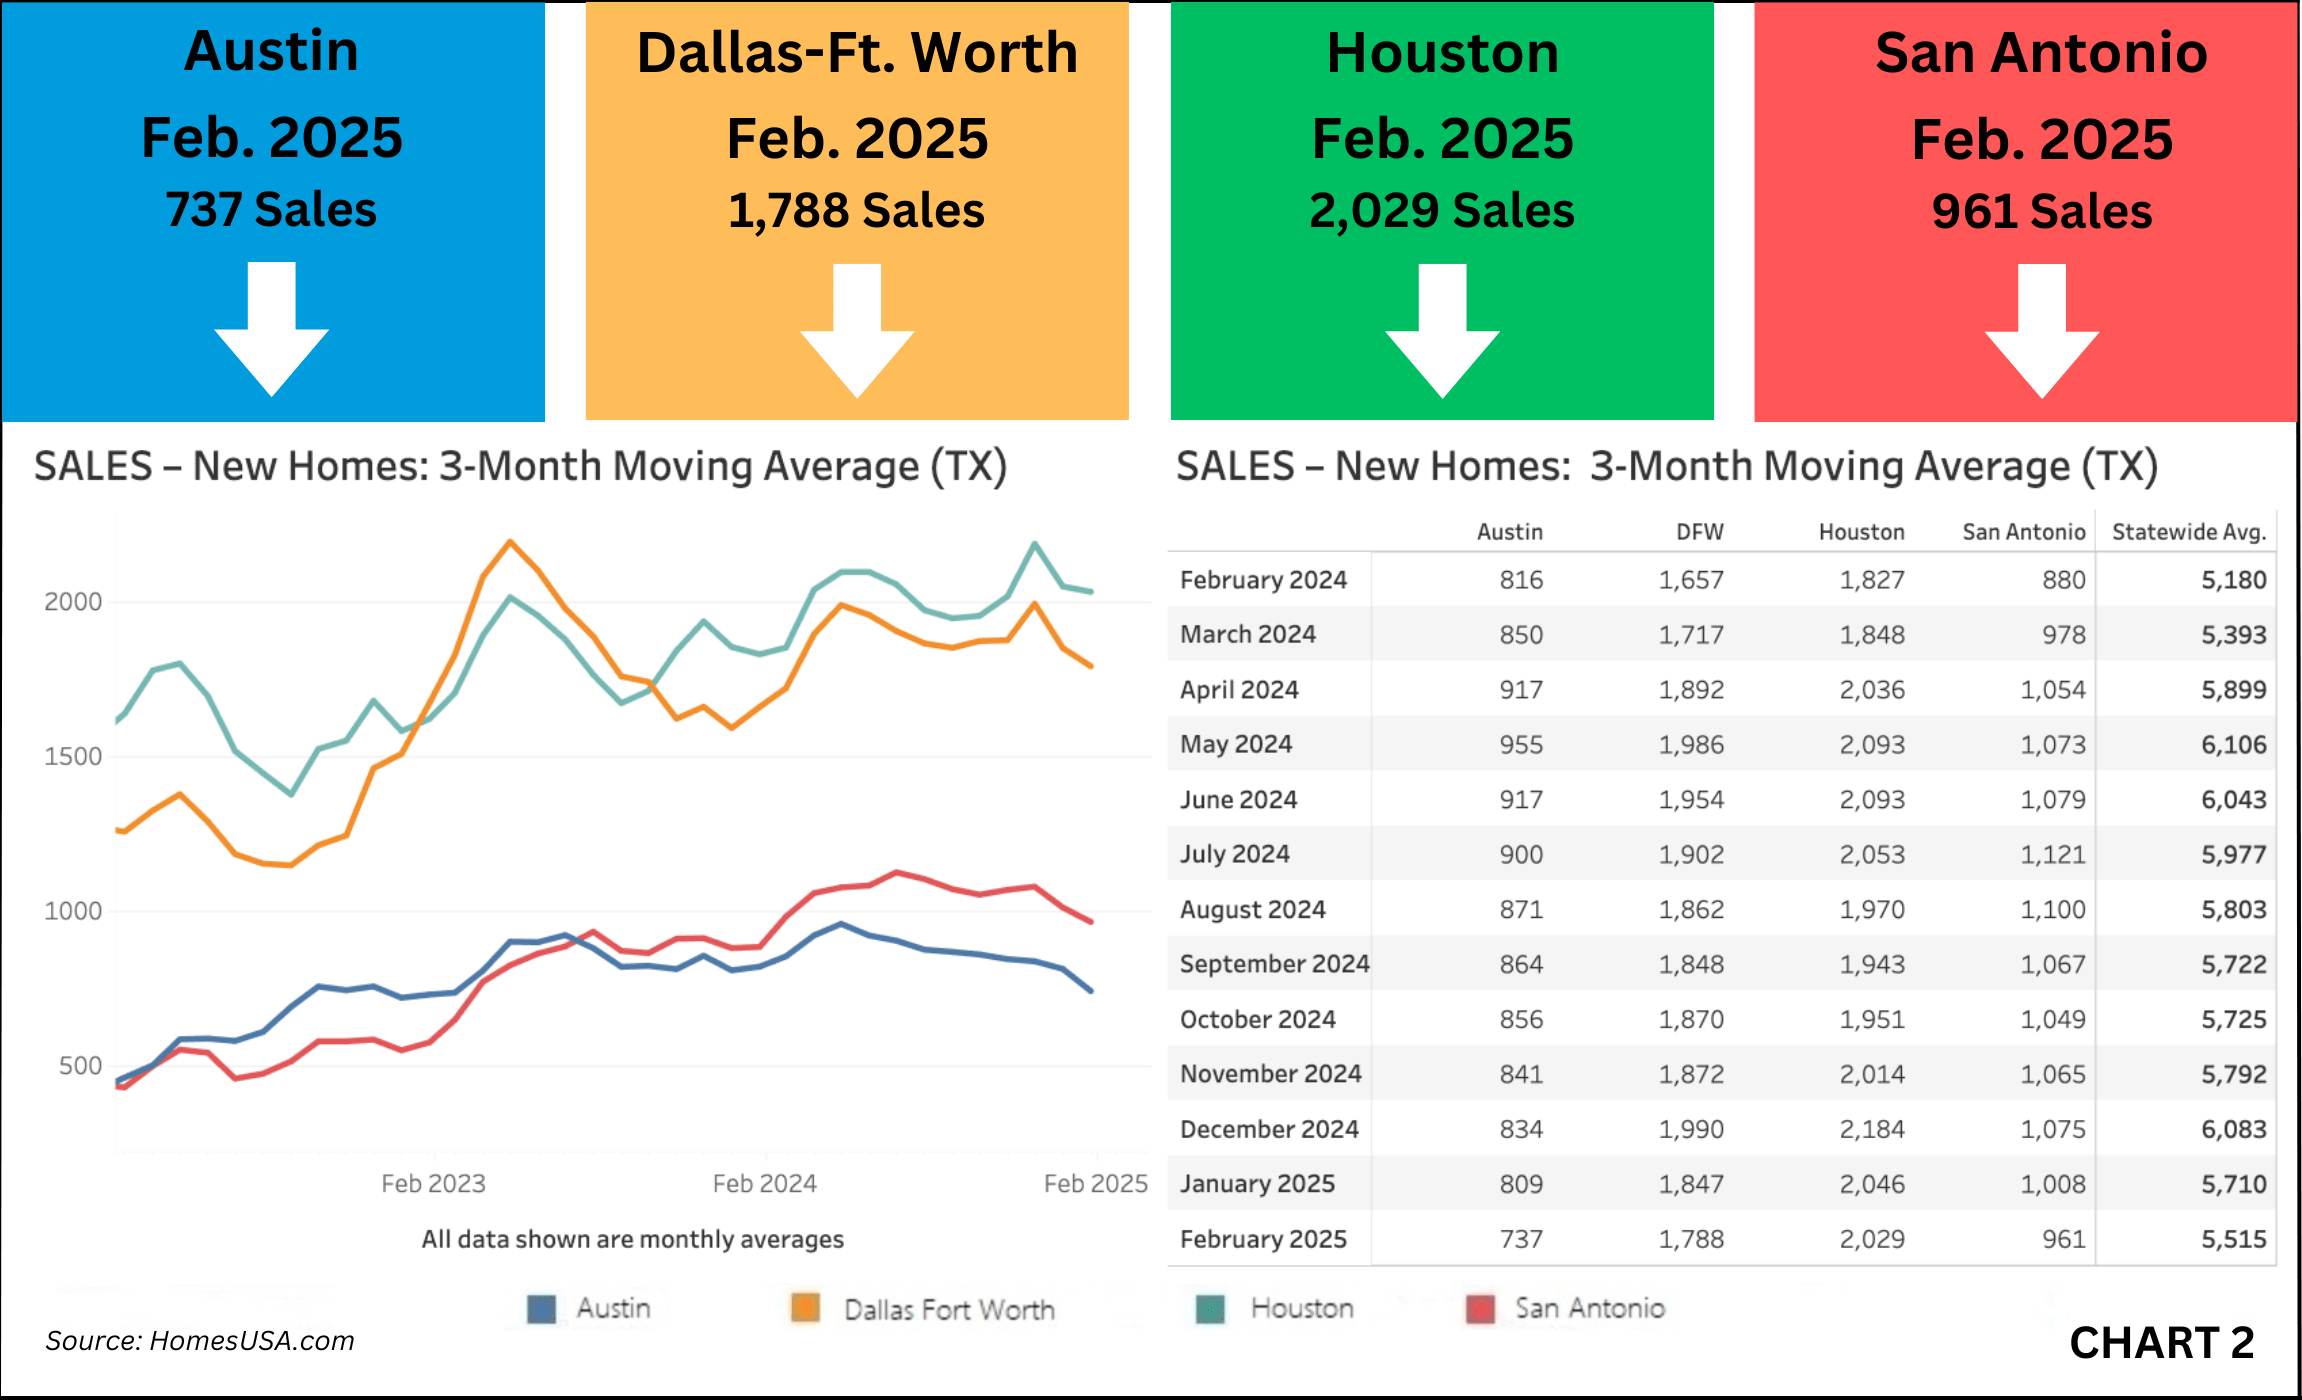
Houston new home sales were 2,029 in February versus 2,046 in January.
"New home sales softened last month in Houston, largely due to high mortgage rates and economic uncertainty,” said Ben Caballero, founder and CEO of HomesUSA.com.
“This is concerning because spring is the traditional start of the home sales season, but right now, the numbers are telling us to expect only a moderate bounce,” said Caballero, adding “This is confirmed by the modest pending sales numbers that are forecasting weak sales the first half of 2025 but that could change if interest rates moderate.”
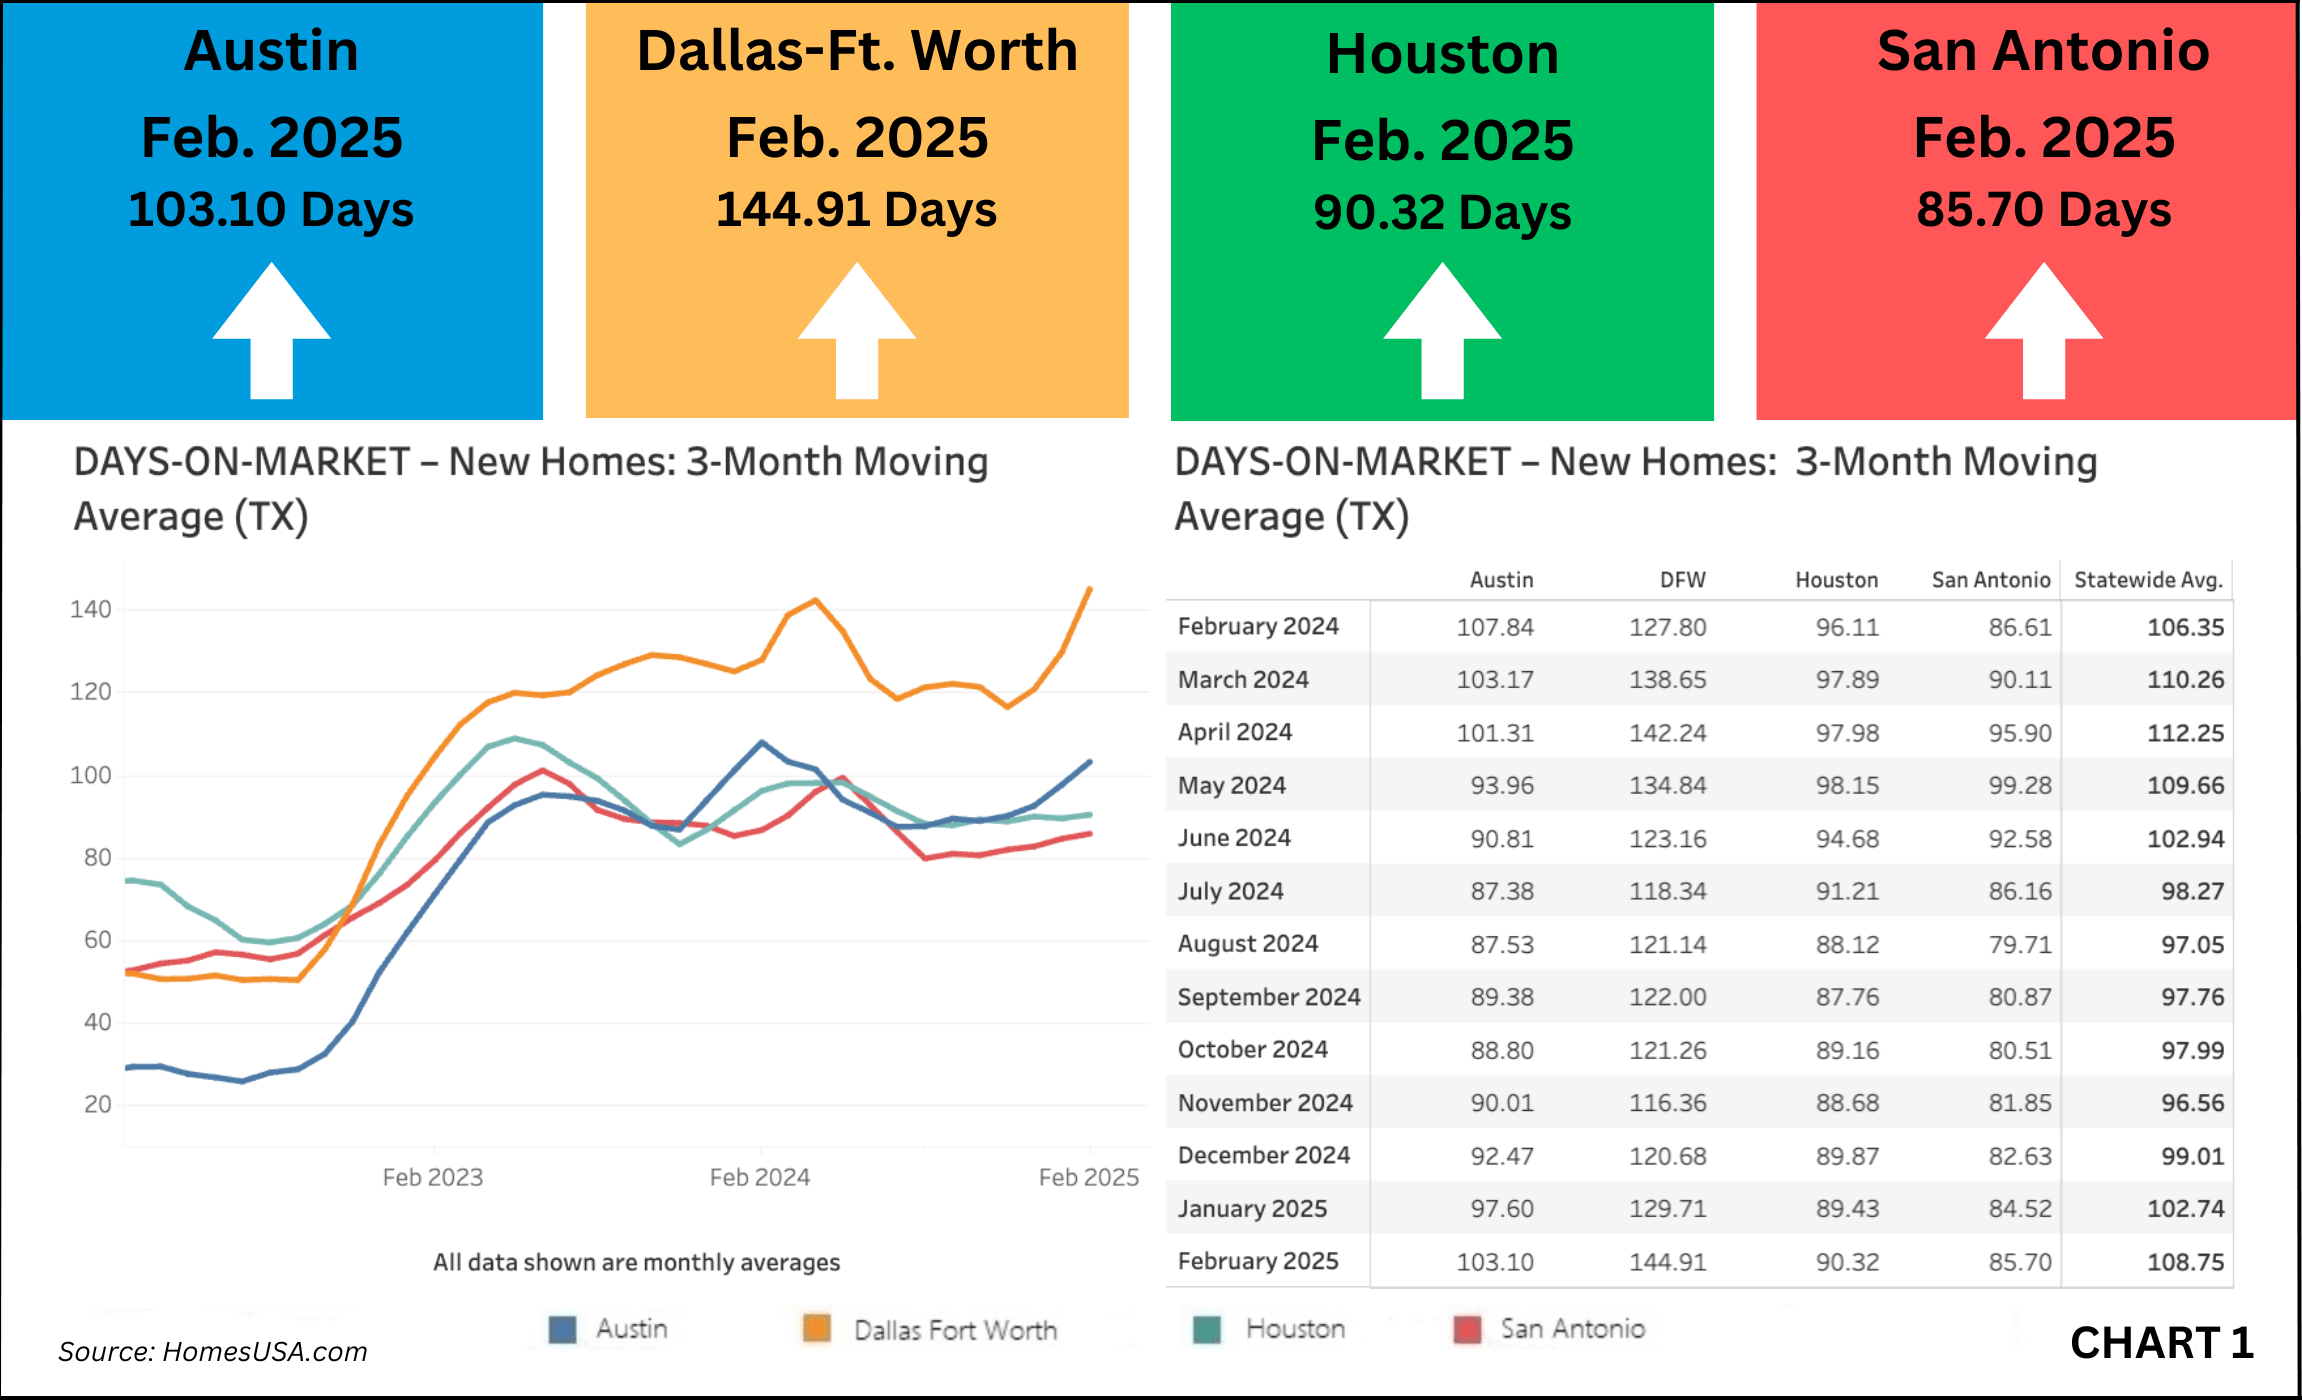
According to HomesUSA.com’s proprietary Texas New Home Sales Index, Days on Market – which measures the speed of a sale – increased last month in Houston as DOM rose slightly. The DOM in February was 90.32 versus 89.43 in January, an indication of modest market expectations for the coming months.
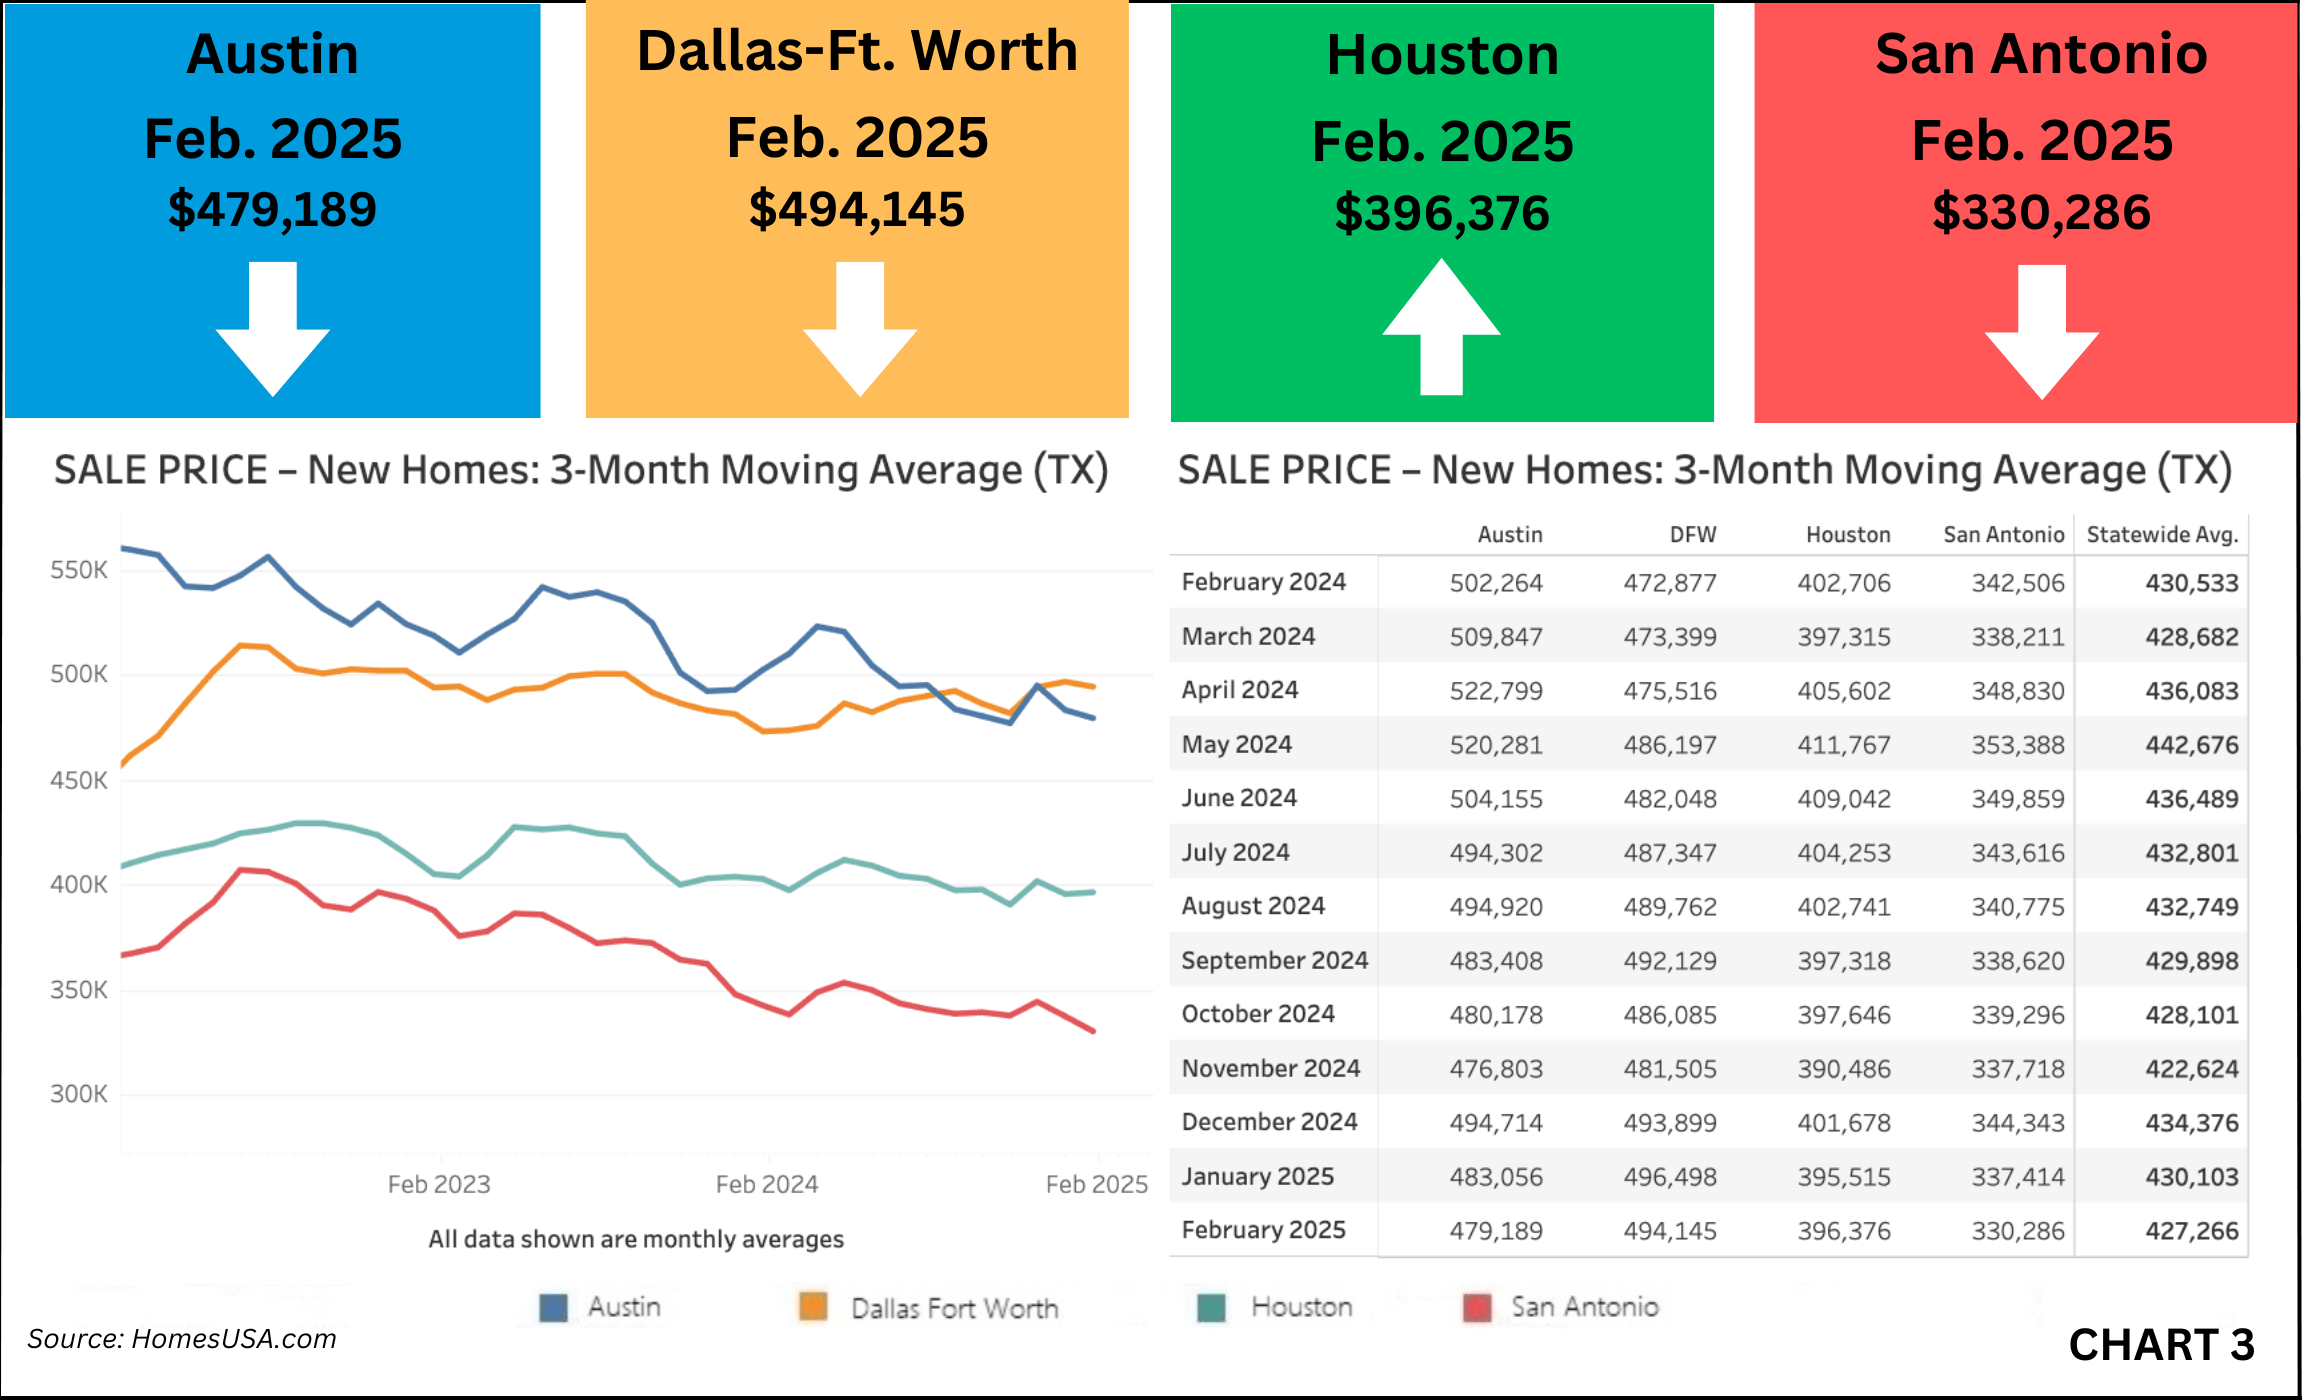
Last month, Houston’s average new home prices ticked higher in February to $396,376 versus $395,515 in January. Prices fell in Texas’ three other largest markets: Dallas-Ft. Worth, San Antonio and Austin.
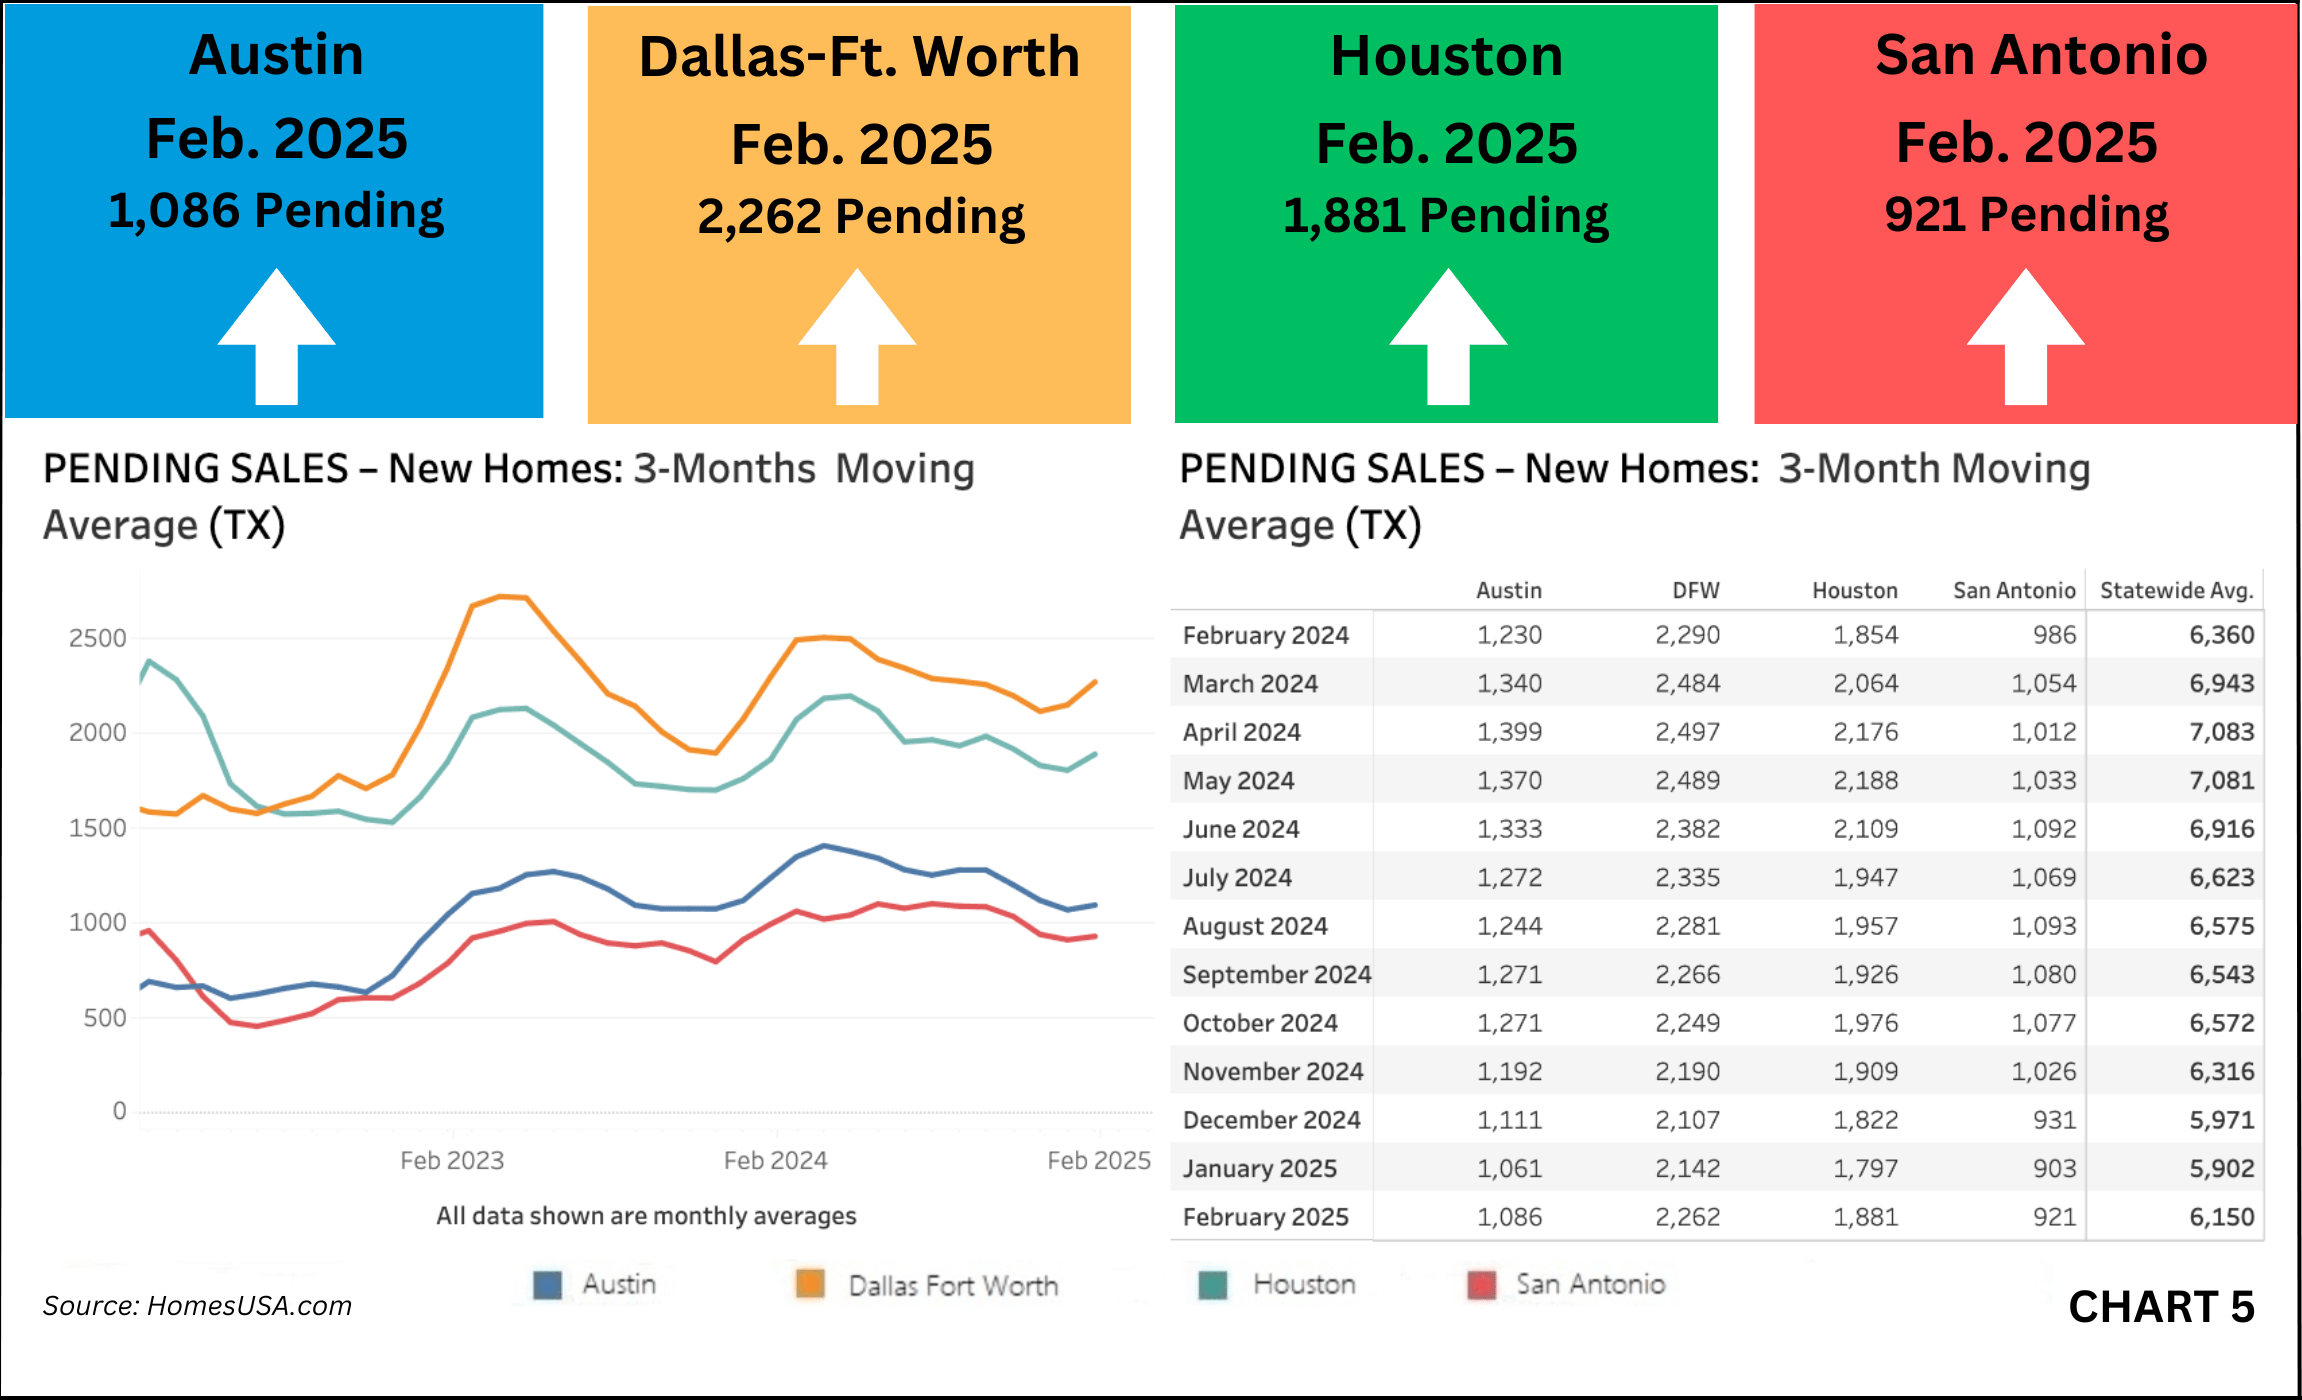
Pending new home sales last month – a key future sales indicator – were higher in Houston, increasing to 1,881 from 1,797 in January.
“These slightly higher numbers indicate Q1 and Q2 sales will be less than robust,” said Caballero.
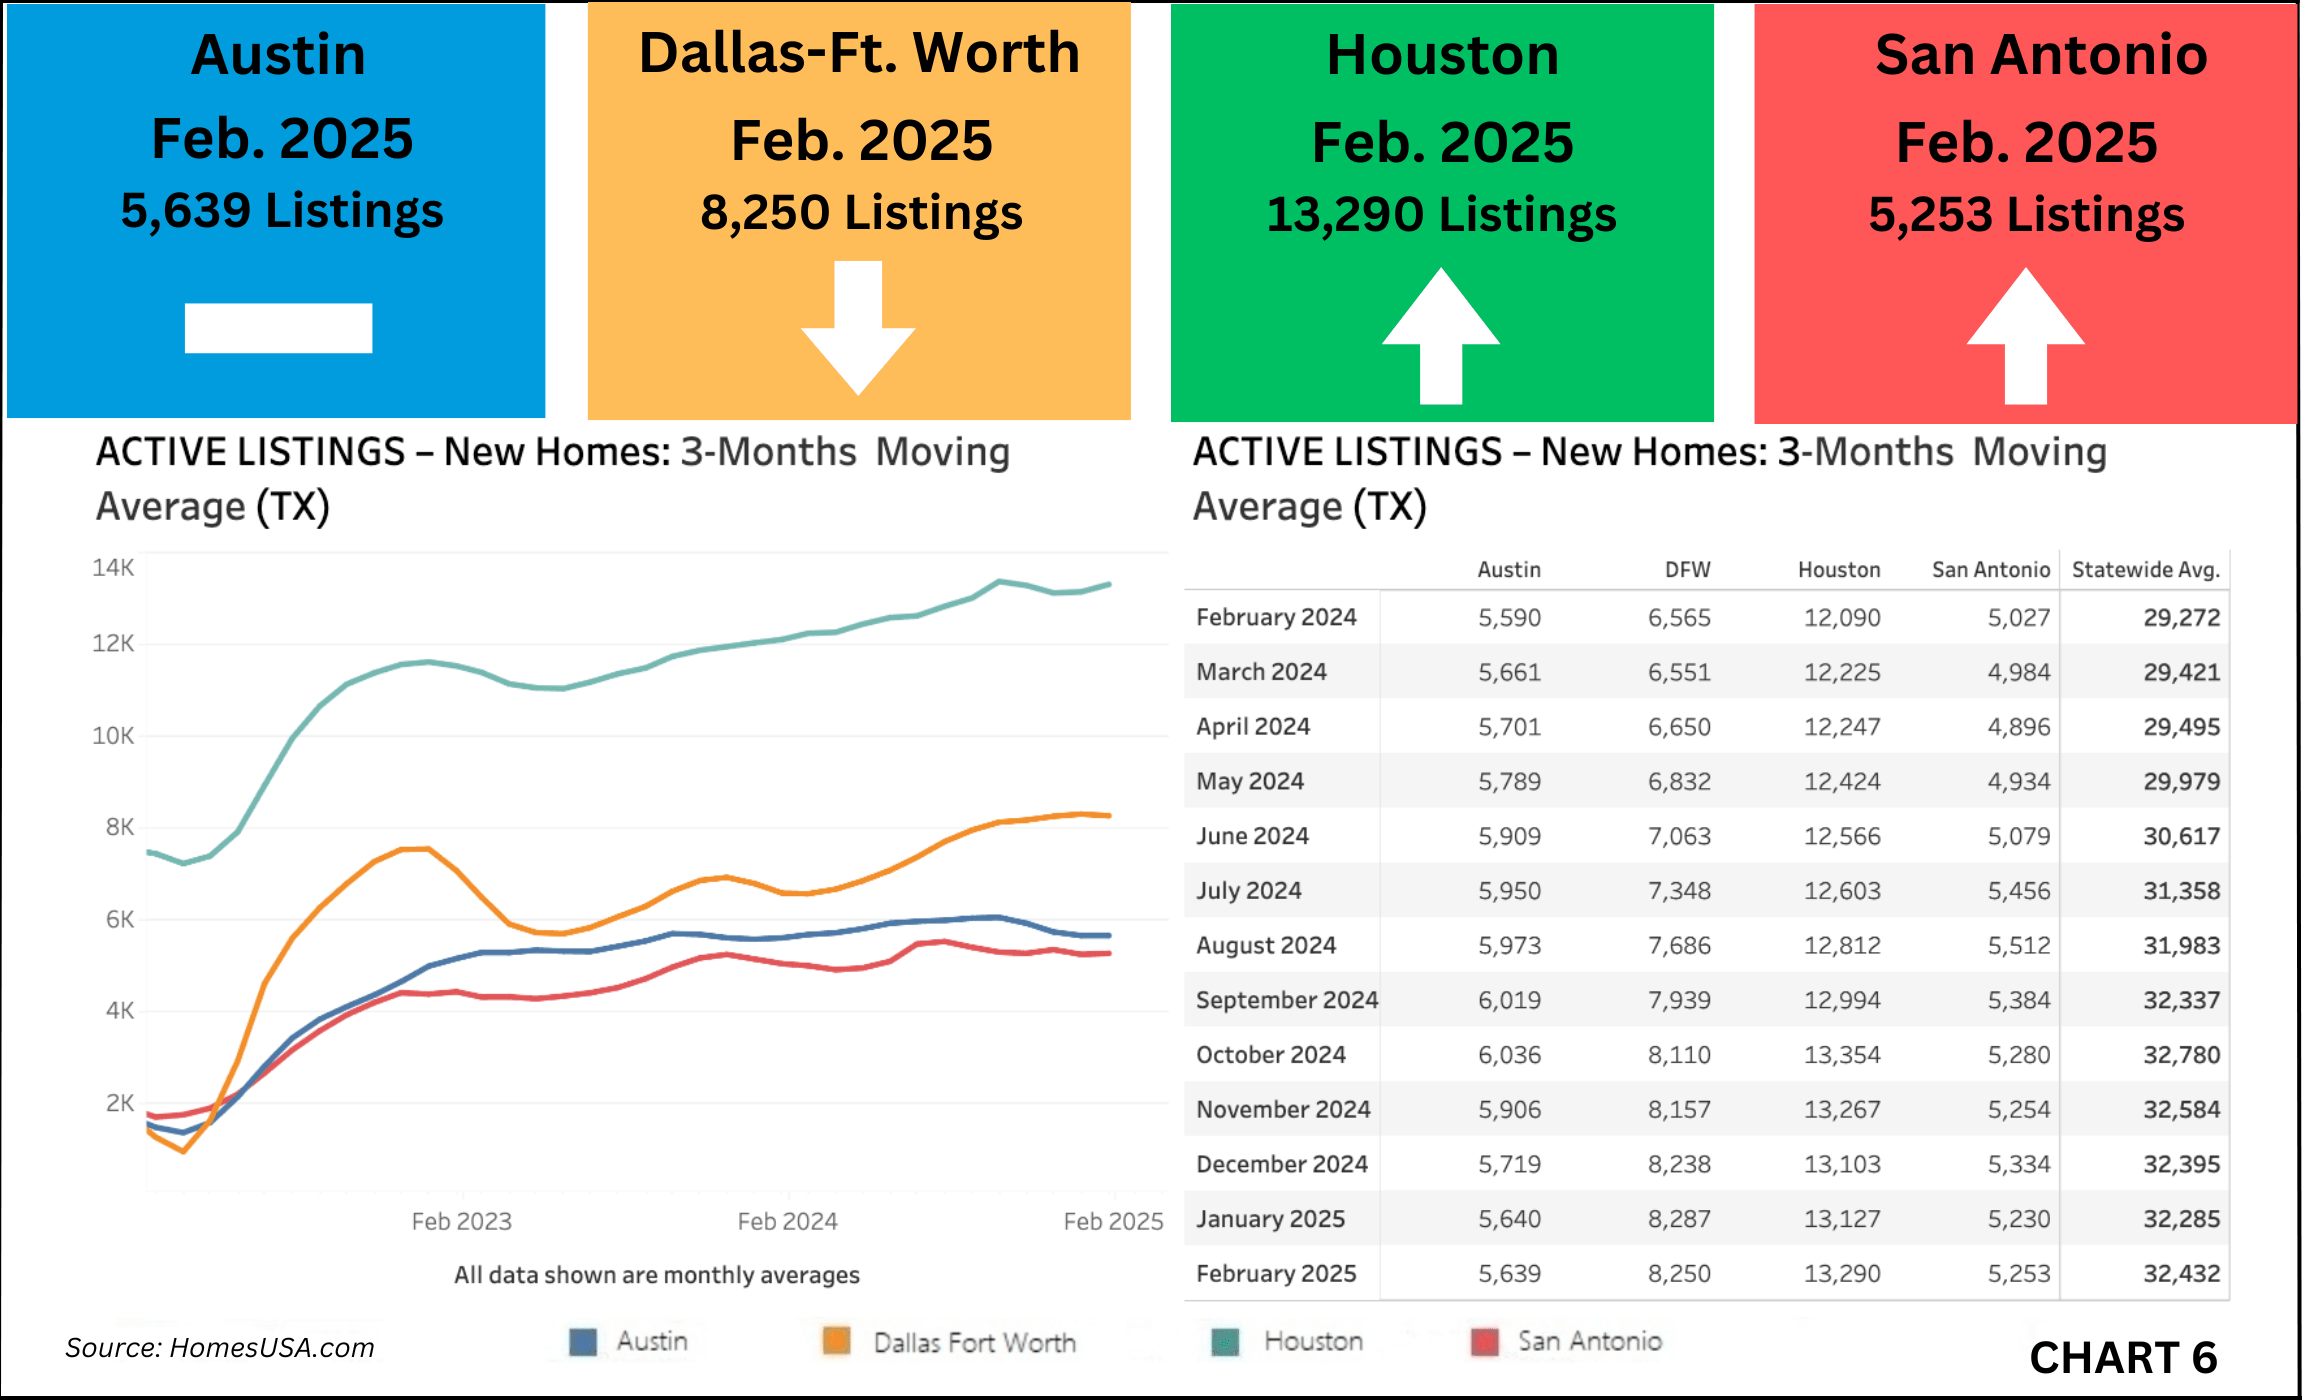
Active listings – an indicator of inventory – also were slightly higher last month in Houston at 13,290 versus 13,127 in January.
HomesUSA.com is sharing its New Home Sales Report and New Home Sales Index at the same time the Commerce Department releases its nationwide New Residential Sales Report for February, set for Tuesday, March 25, 2025, at 10:00 am Eastern time.
About the Report
The HomesUSA.com monthly report covers closed sales recorded in MLSs by the 10th day of the following month. Sales reported by agents after the 10th of the month are not included. The report features 3-month and 12-month moving averages for six essential market data, including DOM, sales volume, sales prices, a sales-to-list price ratio, pending sales, and active listings. Caballero explained the 3-month moving average indices track market seasonality, while the 12-month moving average removes the seasonality and tracks the longer trend.
Days on Market Slow Down – New Homes in Texas (Exclusive Data)
The HomesUSA.com New Home Sales Index showed the February 3-month moving average of DOM continued to slow down in Texas’ four major new home markets. In Dallas-Ft. Worth, the DOM was 144.91 days versus 129.71 days in January. In Houston, the DOM was 90.32 days versus 89.43 days in January. In Austin, the DOM in February was 103.10 days versus 97.60 days in January. In San Antonio, the DOM was 85.70 days versus 84.52 days in January. New homes have significantly higher DOM than existing homes because most new homes are listed while under construction. (See Chart 1: Texas New Homes Days on Market)
Texas New Home Sales Decrease
Based on all local MLS data, the most reliable and current source of all home sales activity, total new home sales continued to decrease in the four largest new home markets in Texas last month. The February 3-month moving average of new home sales in Dallas-Ft. Worth was 1,788 versus 1,847 in January. In Houston, total new home sales in February were lower at 2,029 versus 2,046 in January. In Austin, new home sales last month were 737 versus 809 in January. In San Antonio, new home sales in February were also lower at 961 versus 1,008 in January. (See Chart 2: Texas New Home Sales)
Texas New Home Prices Drop
The average prices of new homes continued to go down in three the four major new home markets in Texas last month. In Dallas-Ft. Worth, the average new home price in February was lower at $494,145 versus $496,498 in January. In Austin, the 3-month moving average price in February was also lower at $479,189 versus $483,056 in January. San Antonio's average new home price in February was $330,286 versus $337,414 in January. Houston was the anomaly, as the 3-month moving average price for new homes in February was higher at $396,376 versus $395,515 in January. (See Chart 3: Texas New Home Prices)
Texas Sales-to-List Price Ratio Remains Stable
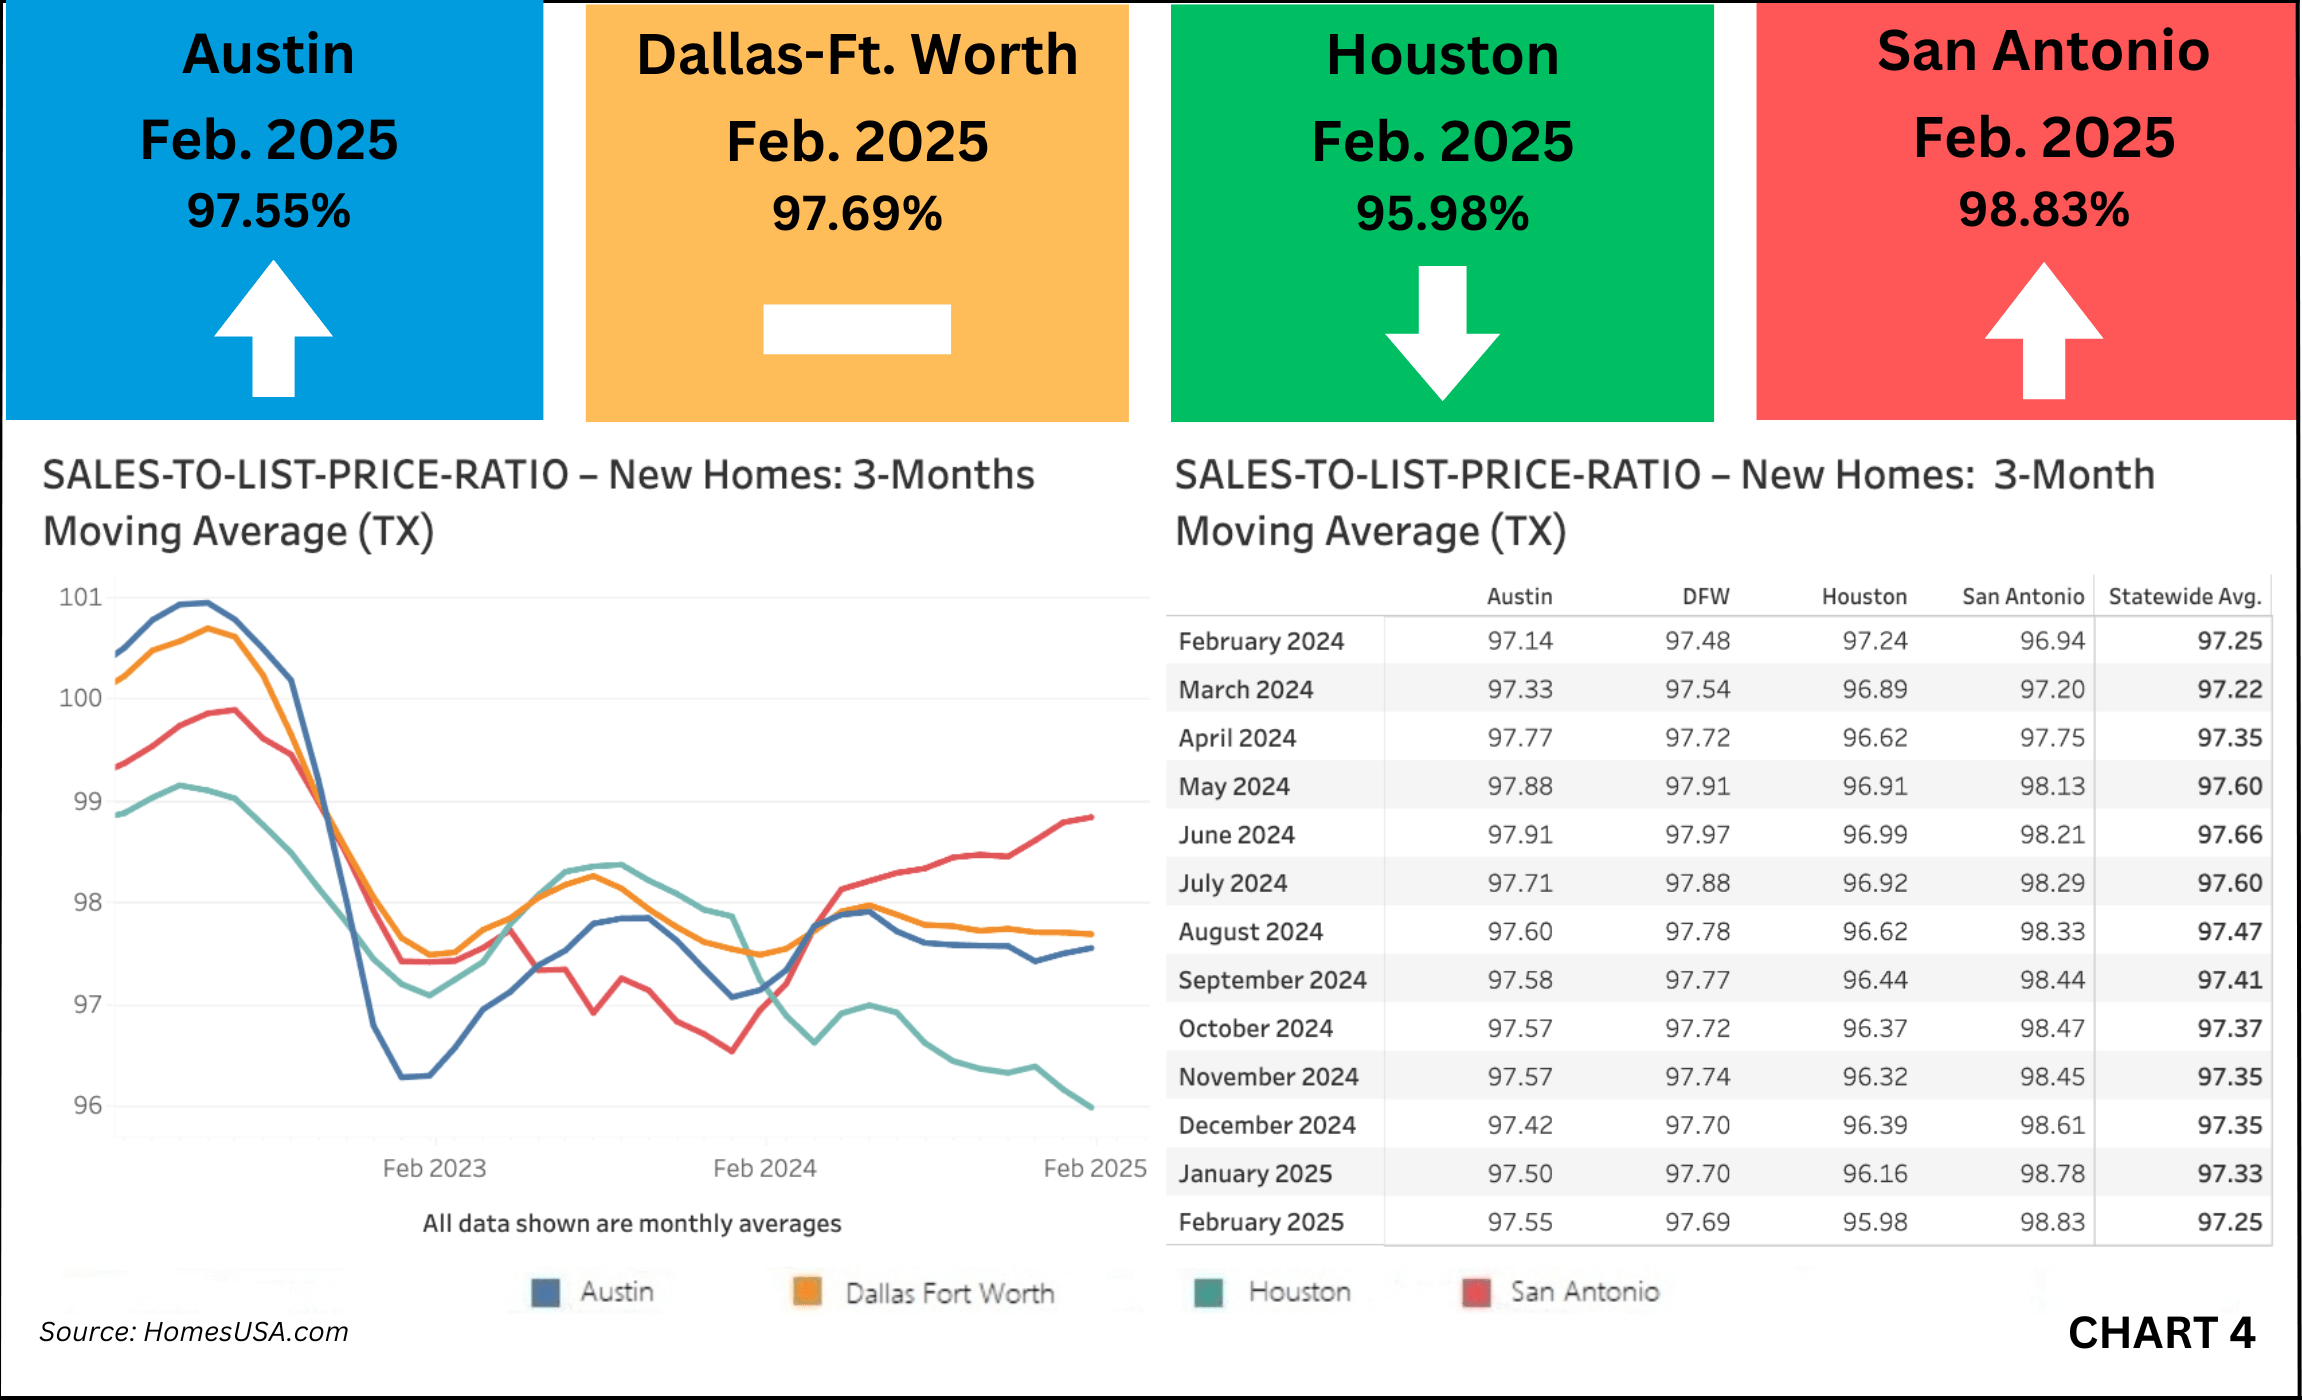
Cumulative new home sales remain slightly lower than 100 percent of the asking price. The combined 3-month moving average of the sales-to-list price ratio in Texas’ four largest markets for February was 97.25 versus 97.25 percent a year ago and 97.33 percent last month. Dallas-Ft. Worth’s ratio in February was 97.69 versus 97.48 percent a year ago and 97.70 percent last month. In Houston, the ratio in February was 95.98 versus 97.24 percent a year ago and 96.16 percent last month. In Austin, the sales-to-price ratio in February was 97.55 versus 97.14 percent a year ago and 97.50 percent last month. San Antonio's ratio in February was 98.83 versus 96.94 percent a year ago and 98.78 percent last month. (See Chart 4: Texas Sales-to-List Price Ratio)
Texas Pending New Homes Sales Increase
Based on local MLS data, the 3-month average of pending new home sales increased in the four largest Texas new home markets. The combined four-market average in February totaled 6,150 versus 5,902 in January. In Dallas-Ft. Worth, pending new home sales last month were 2,262 versus 2,142 in January. In Houston, pending new home sales in February were higher at 1,881 versus 1,797 in January. In Austin, pending new home sales in February increased to 1,086 versus 1,061 in January. In San Antonio, pending new home sales also increased last month to 921 versus 903 in January. (See Chart 5: Texas Pending New Home Sales)
Texas Active Listings for New Homes Show Mixed Results
Active new home listings showed mixed results in the four of the largest Texas new home markets in February. The February 3-month average active listings inventory in Texas’ four major new home markets was 32,432 new homes versus 32,285 in January. Dallas-Ft. Worth's active listings in February were 8,250 versus 8,287 in January. Active listings in Houston last month were 13,290 versus 13,127 in January. In Austin, active listings in February were 5,639 versus 5,640 in January. In San Antonio, active listings last month were 5,253 versus 5,230 in January. (See Chart 6: Texas Active Listings)
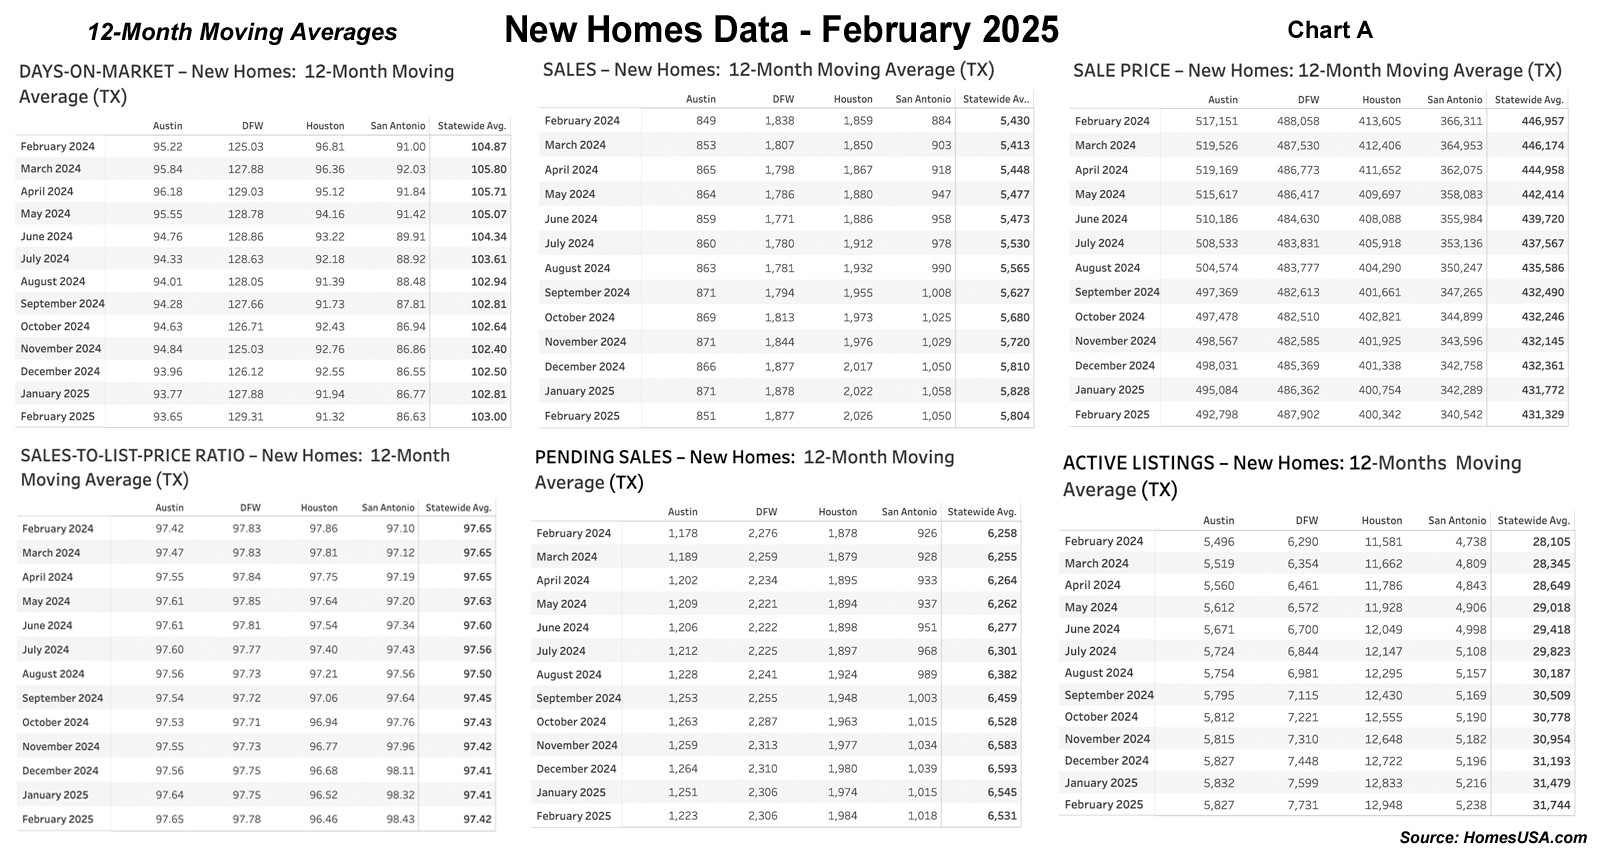
About the HomesUSA.com New Home Sales Index
The HomesUSA.com Index is reported as both a 3-month and 12-month moving average of the Days on Market for new homes listed in the local Multiple Listing Services (MLSs) for Dallas-Ft. Worth, Houston, Austin, and San Antonio. Created by Ben Caballero, it is the first Days on Market index to track the Texas new home market and includes homes listed while under construction. (See Chart A: 12-Month Moving Averages)
*Note: Texas data denotes a combination of its four largest new home markets – Houston, Dallas-Ft. Worth, Austin, and San Antonio – which comprise the vast majority of new home sales and MLS data statewide.
REALTOR® is a federally registered collective membership mark which identifies a real estate professional who is a member of the NATIONAL ASSOCIATION OF REALTORS® and subscribes to its strict Code of Ethics.


