HomesUSA.com reports lower prices, higher sales, and a slightly slower sales pace
Austin new homes sales remained strong last month – despite continuing inventory challenges – with higher home sales, a slight increase on the average Days on Market, and a lower average new home price, according to the latest monthly report from HomesUSA.com.
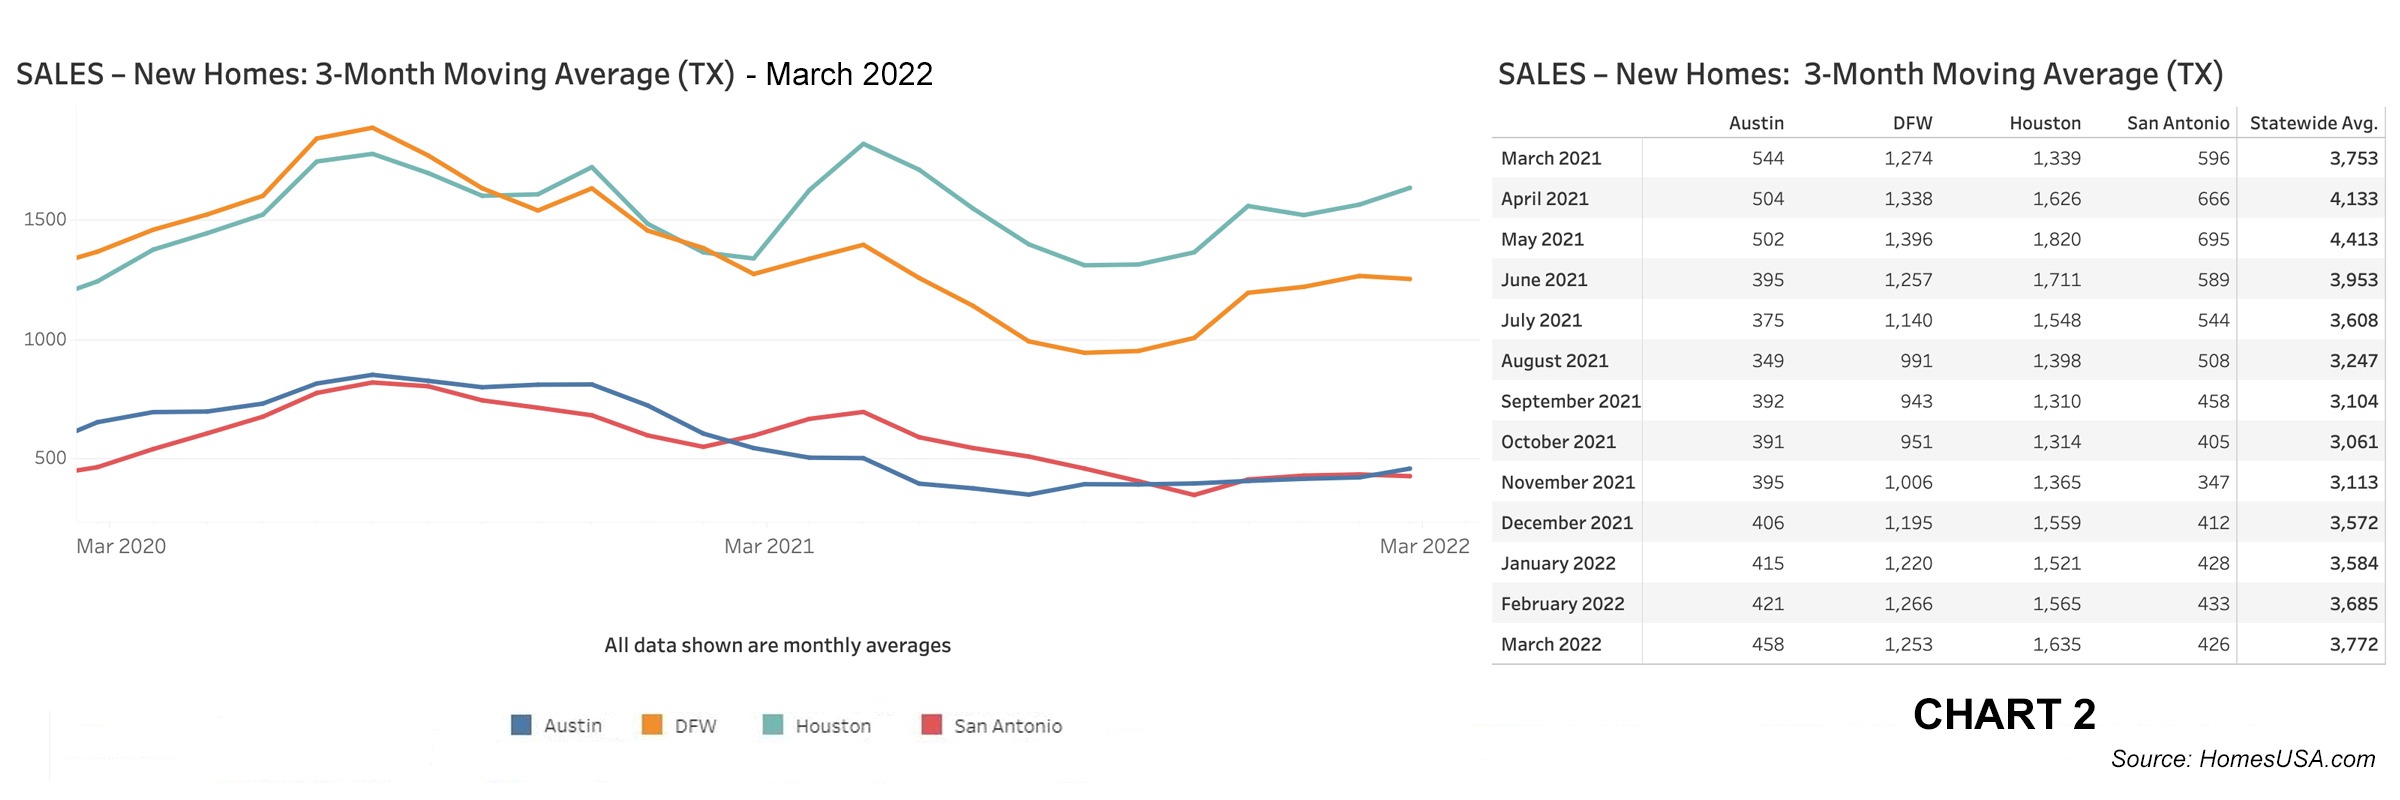
The 3-month moving average of new home sales in Austin shows March sales listed in the Multiple Listing Services increased to 458 from 421 in February. But limited inventory continues as the 3-month moving average for March shows active listings decreasing to 1,463 versus 1,679 in February. Active listings are down 10% from a year ago. In March 2021, the active listings 3-month moving average showed 1,626 new homes in Dallas-Ft. Worth for sale in the MLS.
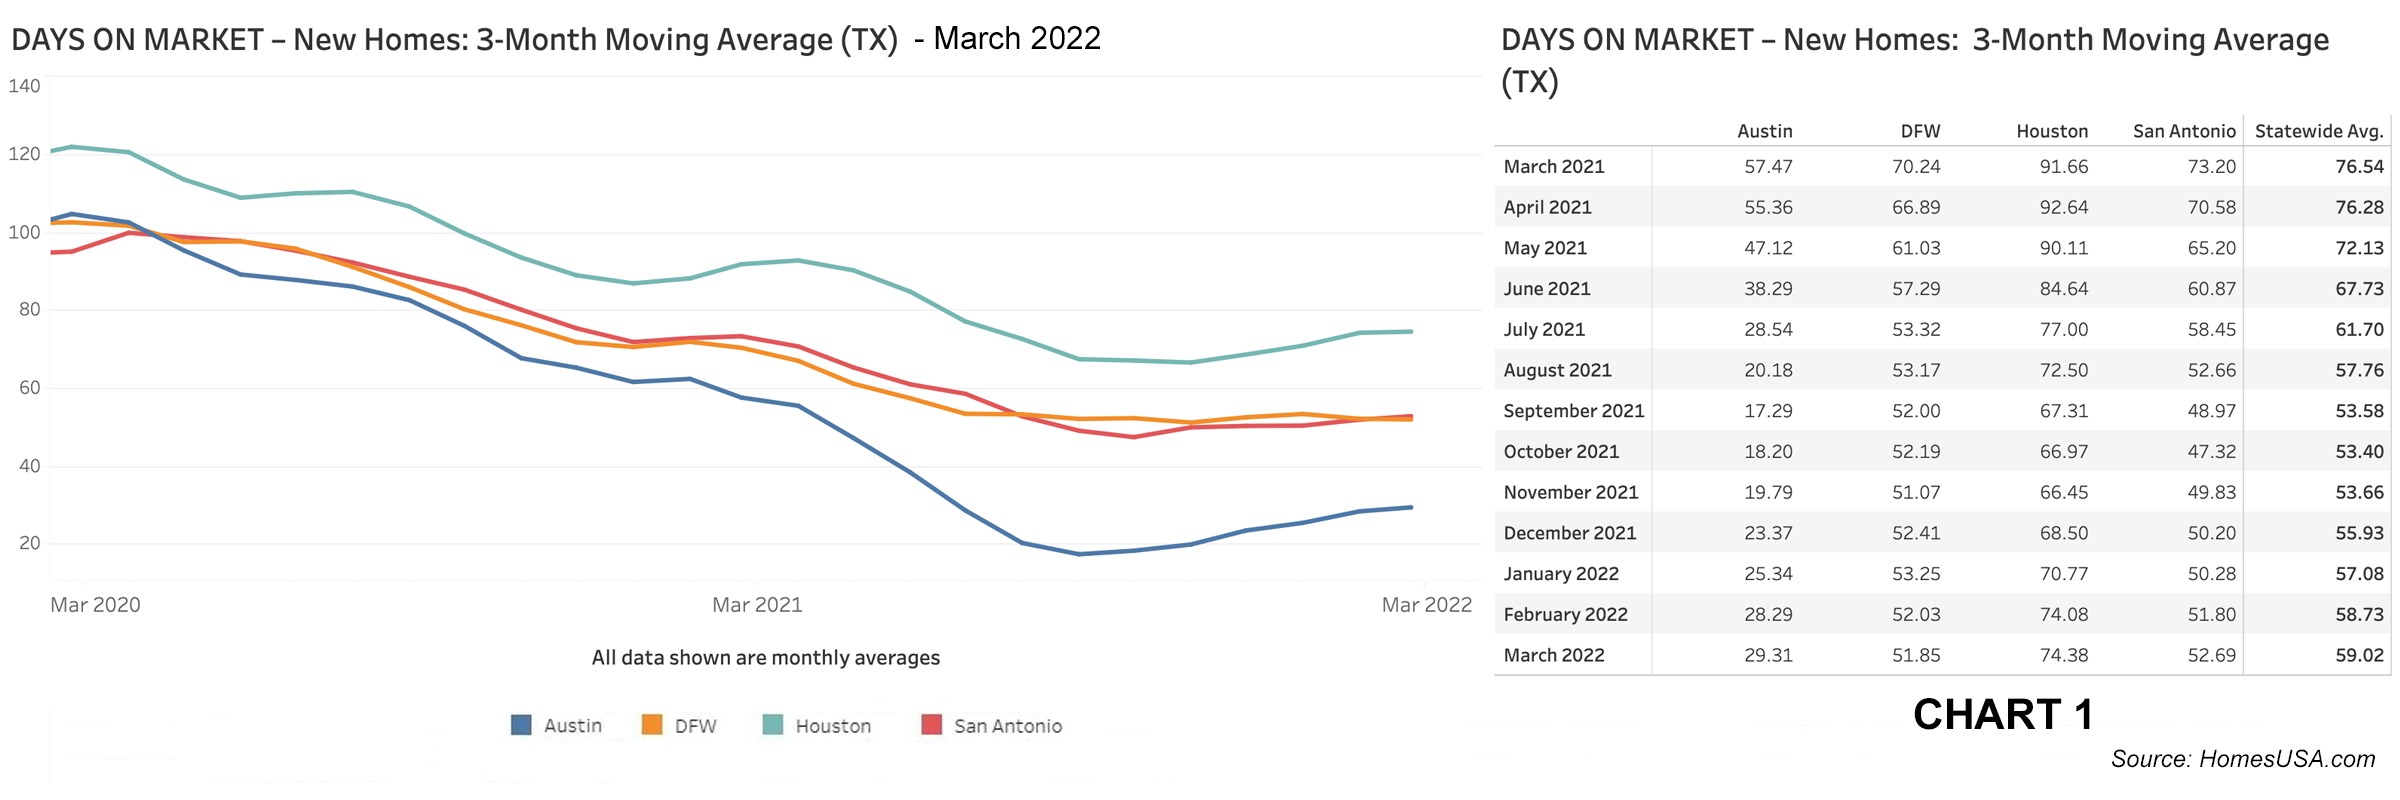
 HomesUSA.com also reports 3-month moving averages showing the sales pace of Austin new home sales slowed slightly last month. The average Days on Market for a new home in Dallas-Fort Worth was 29.31 days versus 28.29 days in February, according to the HomesUSA.com New Home Sales Index.
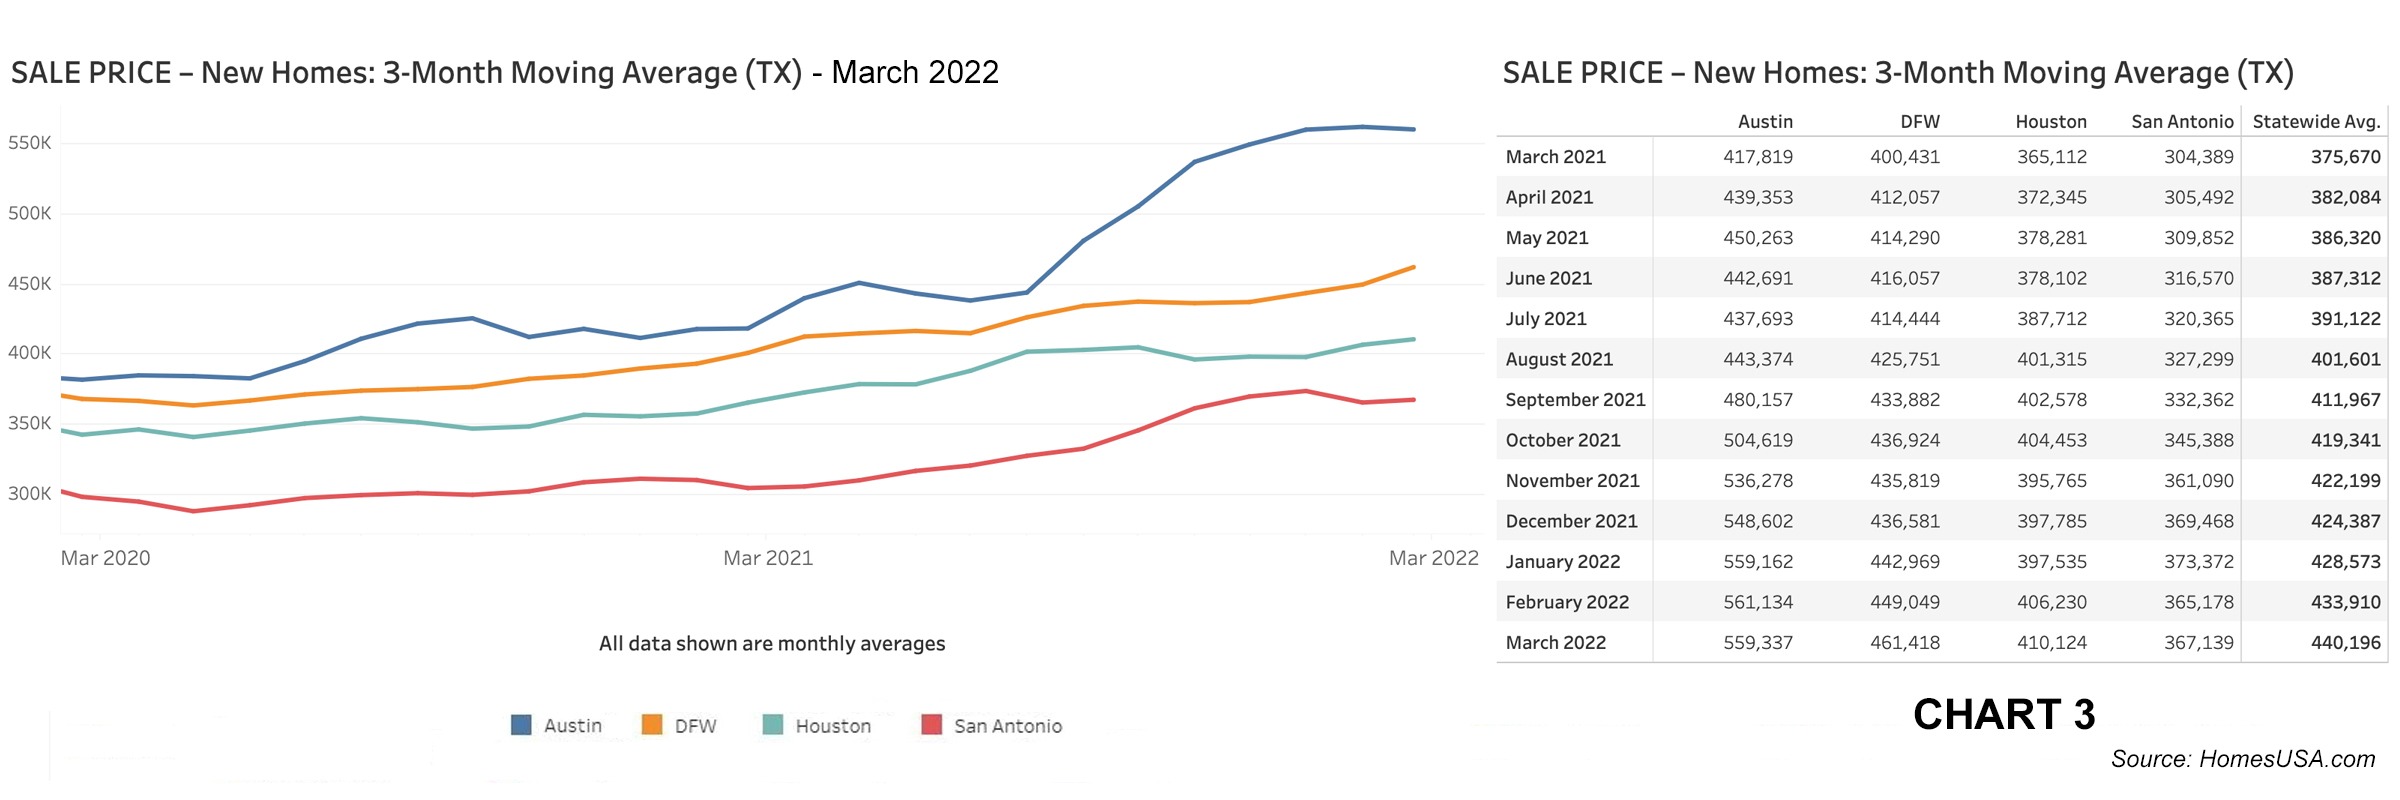
New home prices in Austin decreased last month. The 3-month moving average of new home sale prices was $559,337 versus $561,134 in February – up over $142,000 since March 2021, an increase of 34 percent, year-over-year.
The HomesUSA.com March 2022 new homes report that includes Austin, Dallas-Ft. Worth, Houston, and San Antonio features data from the Austin Board of REALTORS, North Texas Real Estate Information Systems, Houston Association of REALTORS, and San Antonio Board of REALTORS.
“The Austin new homes market remains strong, despite inventory challenges,” said Ben Caballero, CEO of HomesUSA.com, a two-time world record holder for most home sales, and a top US new home sales expert. “Builders are responding aggressively to meet continuing demand,” Caballero added.
Caballero notes that builders are listing more new homes in the MLS (Multiple Listing Service), which remains the most reliable and timely source of all residential sales activity. New homes have been selling so fast that builders have not been listing all their inventory in the MLS, yet that continues to improve.
Caballero is sharing the HomesUSA.com New Homes Report in advance of the release by the Commerce Department of its nationwide New Residential Sales Report for March, set for Tuesday, April 26 at 10:00 am Eastern.
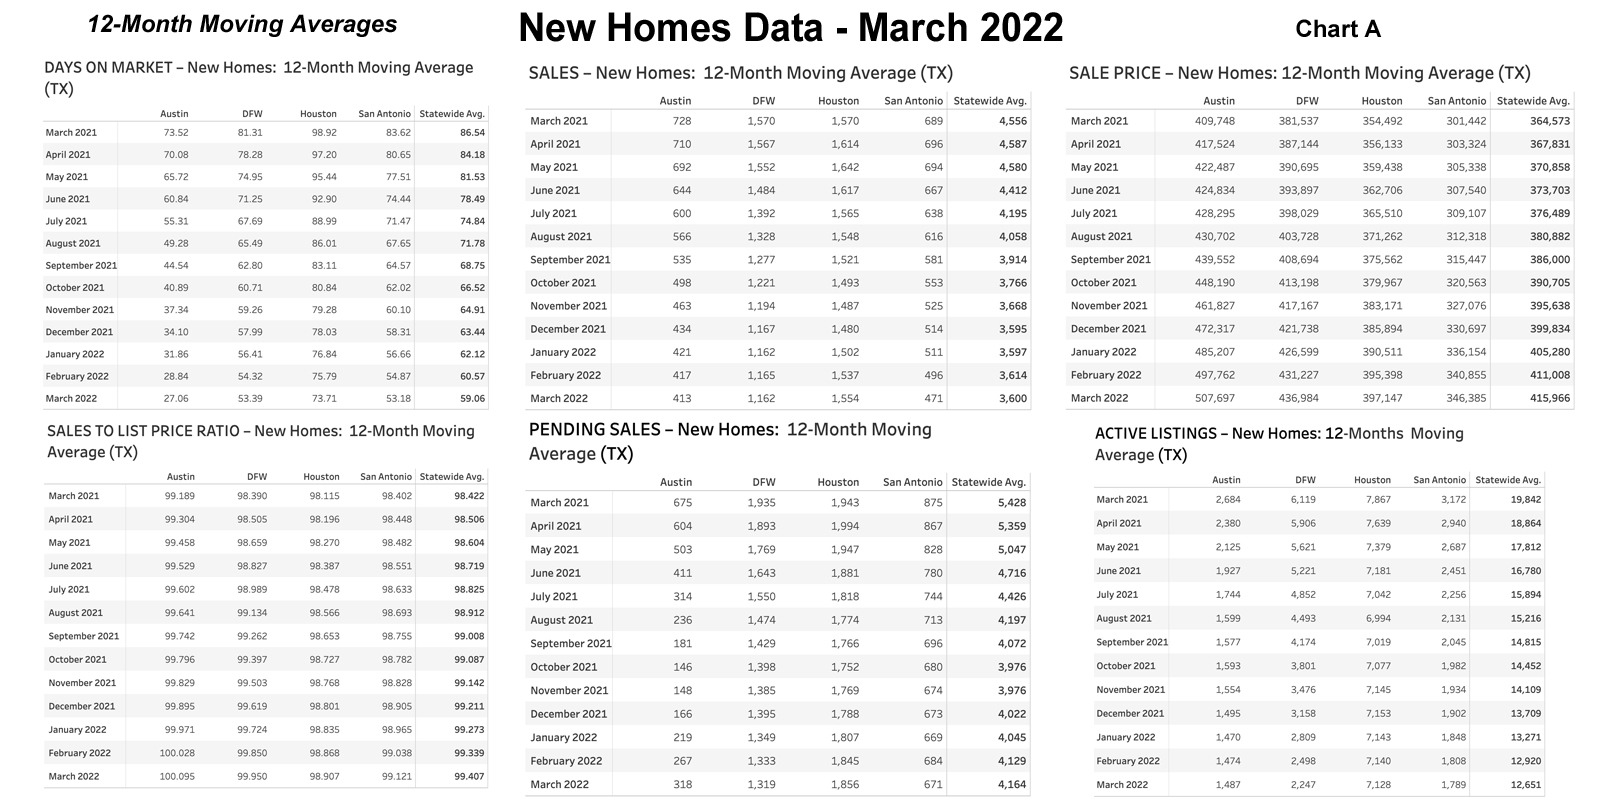
Caballero noted this monthly HomesUSA.com report includes both 3-month and 12-month moving averages for six essential market data, including Days on Market, sales volume, sales prices, a sales-to-list price ratio, pending sales, and active listings. The 3-month moving average indices track market seasonality, while the 12-month moving average removes the seasonality and tracks the longer trend.
Days on Market – New Homes in Texas (Exclusive Data)
The HomesUSA.com New Home Sales Index showed the 3-month moving average of Days on Market rose statewide and in three of the four Texas major new home markets in March. In Austin, the DOM was 29.31 days versus 28.29 days in February. Houston’s DOM was 74.38 days versus 74.08 days in February. In San Antonio, the DOM was 52.69 days versus 51.80 days in February. Dallas-Ft. Worth was the exception, as its DOM decreased to 51.85 days from 52.03 days in February. (See Chart 1: Texas New Homes Days on Market)
Texas New Home Sales Data
Based on all available local MLS data, total new home sales in Texas were higher statewide and in two of the four major new home markets last month, according to the 3-month moving average. In Austin, March sales totaled 458 versus 421 in February. In Houston, March total sales were 1,635 versus 1,565 in February. In San Antonio, new home sales decreased to 426 from 433 in February. Dallas-Ft. Worth new home sales also decreased to 1,253 versus 1,266 in February. (See Chart 2: Texas New Home Sales)
Texas New Home Prices
The average price of new homes in Texas shows higher prices statewide and in three of the four major new home markets last month. Austin's 3-month moving average price – the highest among the top four markets, was the exception, as it decreased in March to $559,337 versus $561,134 in February. Dallas-Ft. Worth reported its 3-month moving average price for new homes was higher in March at $461,418 versus $449,049 in February. Houston's average new home price was also higher in March at $410,124 versus $406,230 in February. In San Antonio, the average new home price was higher in March at $367,139 versus $365,178 in February. (See Chart 3: Texas New Home Prices)
Texas Sales-to-List Price Ratio
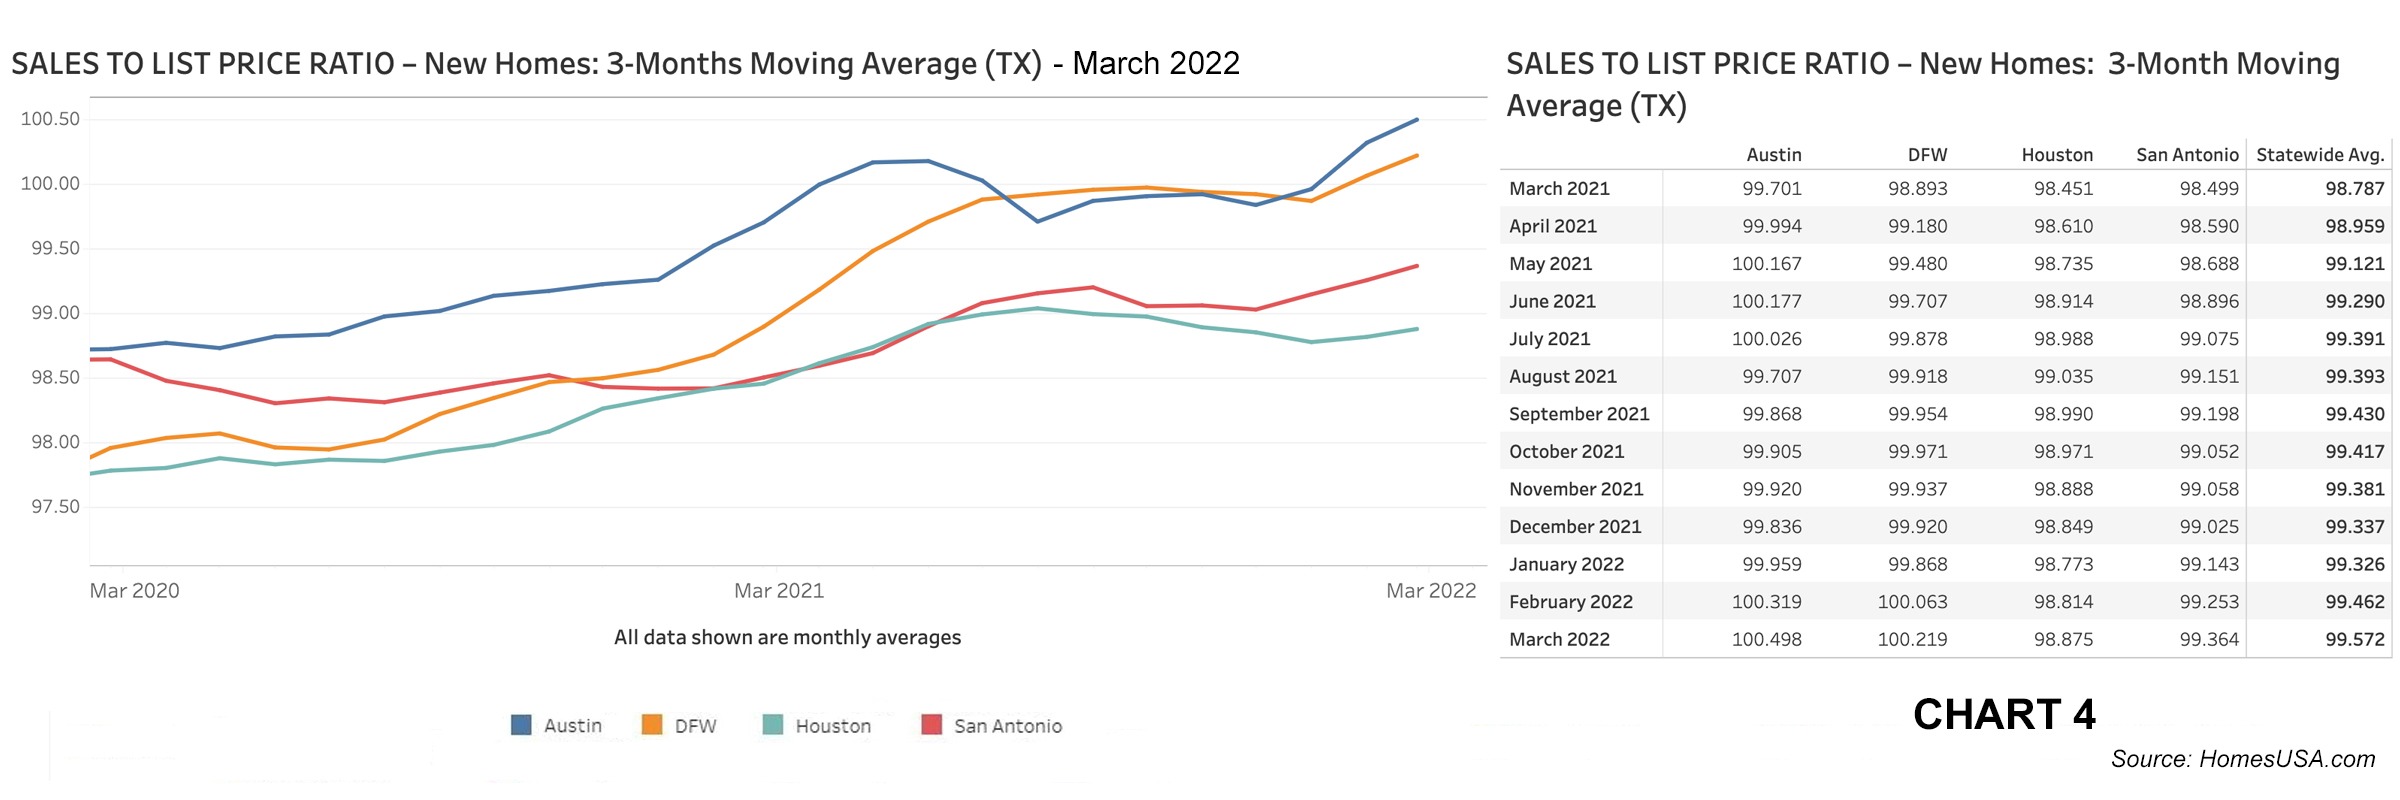
New home sales statewide and in Austin, Dallas-Ft. Worth, Houston, and San Antonio still hover close to 100 percent of the asking price. Statewide, the 3-month moving average of the sales-to-list price ratio in March was 99.572 percent versus 99.462 percent in February. In Austin, the sales-to-price ratio in March was 100.498 percent versus 100.319 percent in February. Dallas-Ft. Worth was 100.219 percent versus 100.063 percent in February. In Houston, the ratio was 98.875 percent versus 98.814 percent in February. San Antonio's ratio in March was 99.364 percent versus 99.253 percent in February. (See Chart 4: Texas Sales-to-List Price Ratio)
Texas Pending New Homes Sales Data
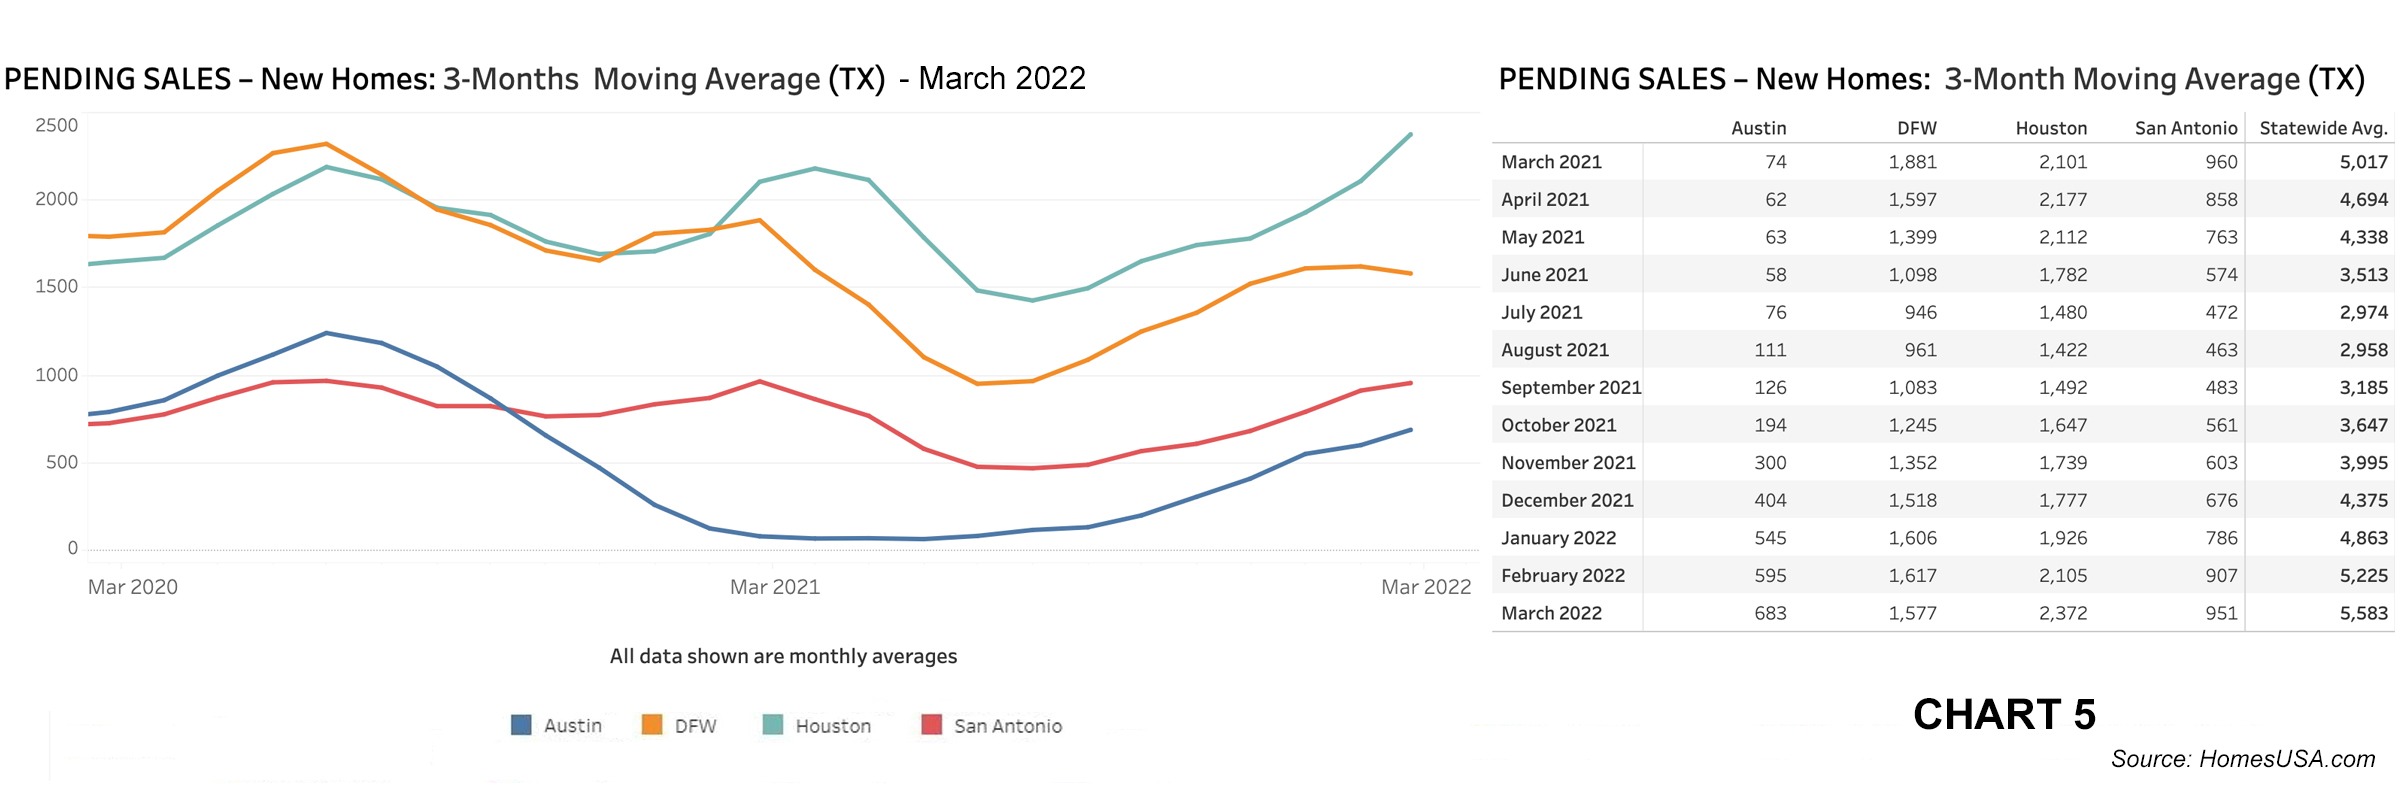
Based on local MLS data, pending new home sales totals were higher statewide and in three of Texas's four major new home markets last month. Statewide MLS data shows pending sales in March were 5,583 versus 5,225 in February. Austin's pending sales in March were 683 versus 595 in February. Houston’s pending sales in March were 2,372 versus 2,105 in February. In San Antonio, pending sales last month were 951 versus 907 in February. Dallas-Ft. Worth was the outlier, as pending sales in March were 1,577 versus 1,617 in February. (See Chart 5: Texas Pending New Home Sales)
Texas Active Listings for New Homes
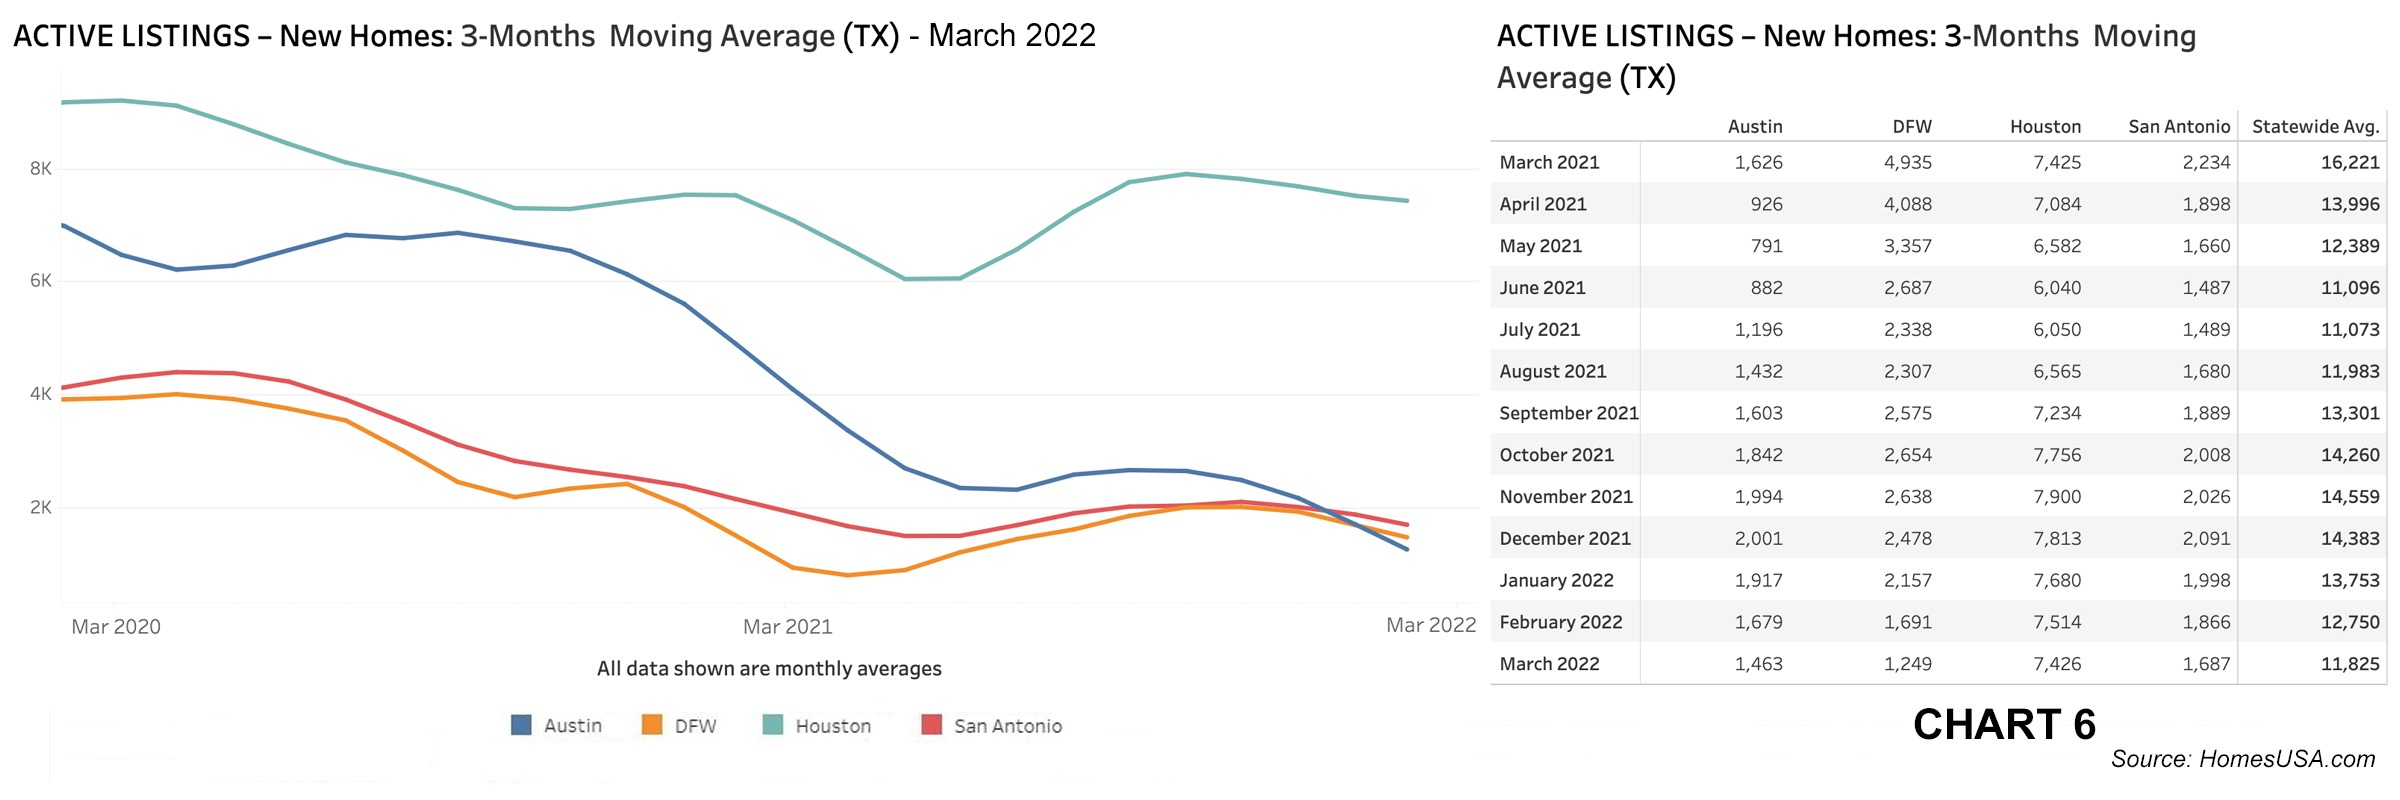
MLS data shows the 3-month moving average for active listings statewide declined slightly in March to 11,825 versus 12,750 in February. Last month, all four major Texas new home markets posted lower active listings. March’s active listings were lower at 1,463 versus 1,679 in February in Austin. Dallas-Ft. Worth's active listings in March were 1,249 versus 1,691 in February. Last month's active listings in Houston were 7,426 versus 7,514 in February. San Antonio reported active new home listings in March were 1,687 versus 1,866 in February. (See Chart 6: Texas Active Listings and Chart A: 12-Month Moving Averages)
About the HomesUSA.com New Home Sales Index
The HomesUSA.com Index is reported as both a 3-month and 12-month moving average of the Days on Market (DOM) for new homes listed in the local Multiple Listing Services (MLSs) for the four largest Texas markets, including Dallas-Ft. Worth, Houston, Austin, and San Antonio. Created by Ben Caballero, founder and CEO of HomesUSA.com, it is the first Days on Market index to track Texas's new home market and includes homes listed while under construction.
About Ben Caballero and HomesUSA.com®
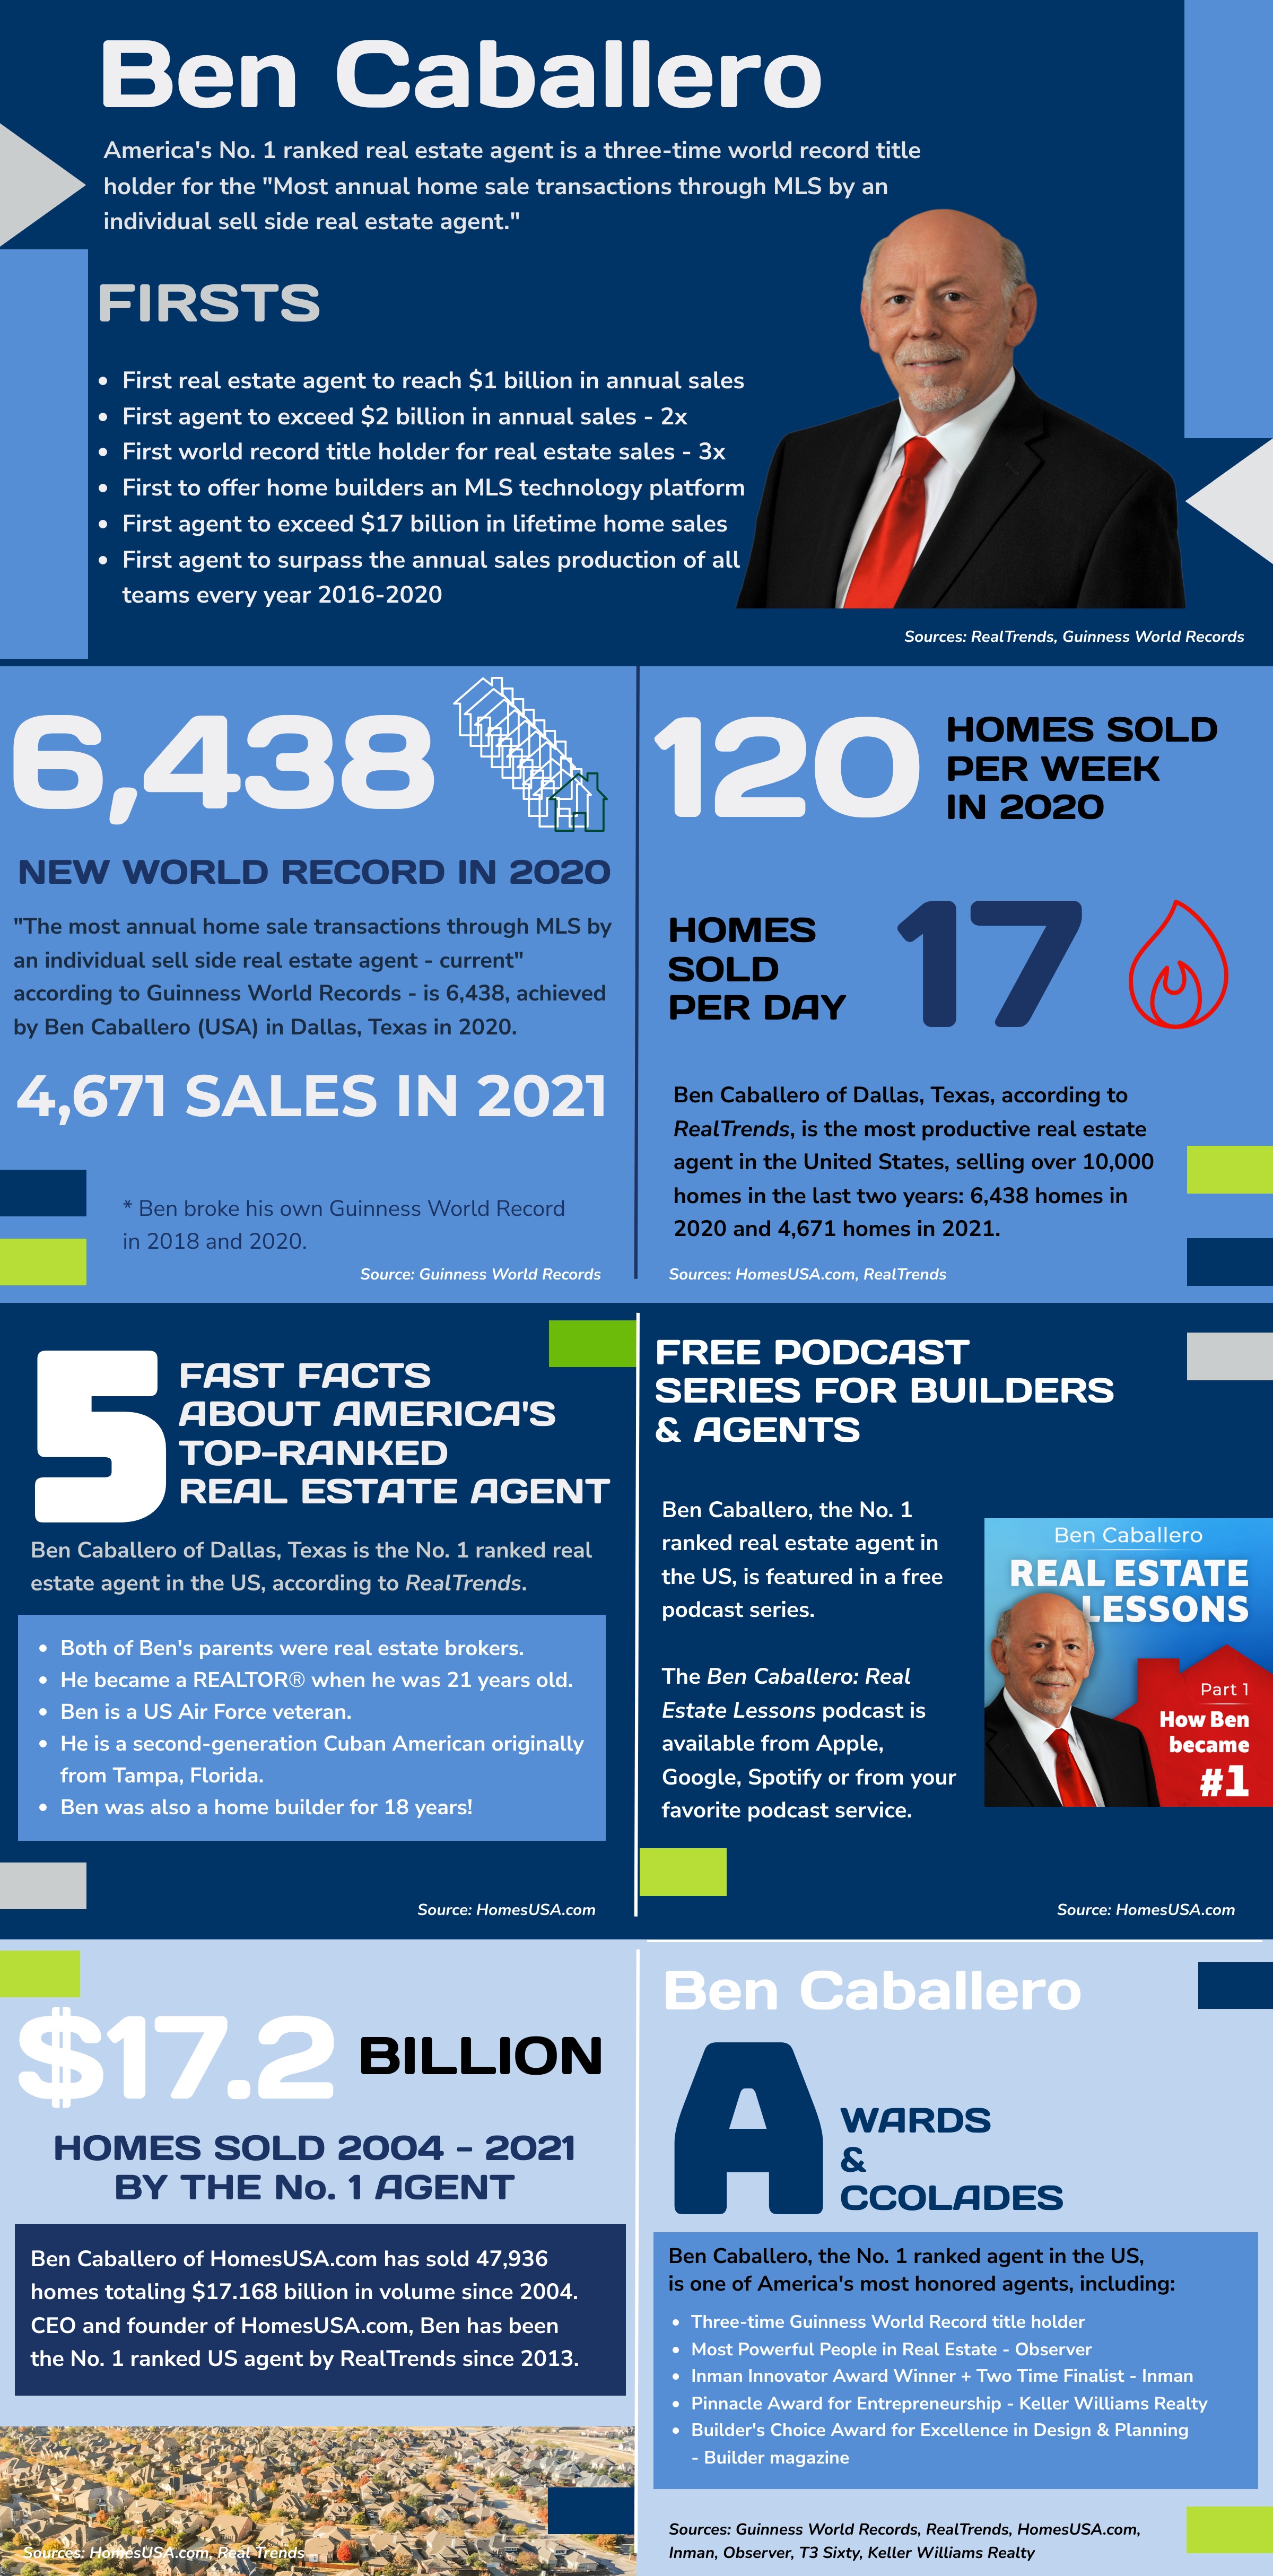
Ben Caballero, founder and CEO of HomesUSA.com, is the world record holder for "Most annual home sale transactions through MLS by an individual sell-side real estate agent." Ranked by REAL Trends as America's top real estate agent for home sales since 2013, Ben is the most productive real estate agent in U.S. history. He is the only agent to exceed $1 billion in residential sales transactions in a single year, a feat first achieved in 2015 and repeated each year through 2018 when he achieved more than $2 billion. An award-winning innovator and technology pioneer, Ben works with more than 60 home builders in Dallas-Fort Worth, Houston, Austin, and San Antonio. His podcast series is available on iTunes and Google Podcasts. An infographic illustrating Ben’s sales production is here. Learn more at HomesUSA.com |Twitter: @bcaballero - @HomesUSA | Facebook: /HomesUSAdotcom.