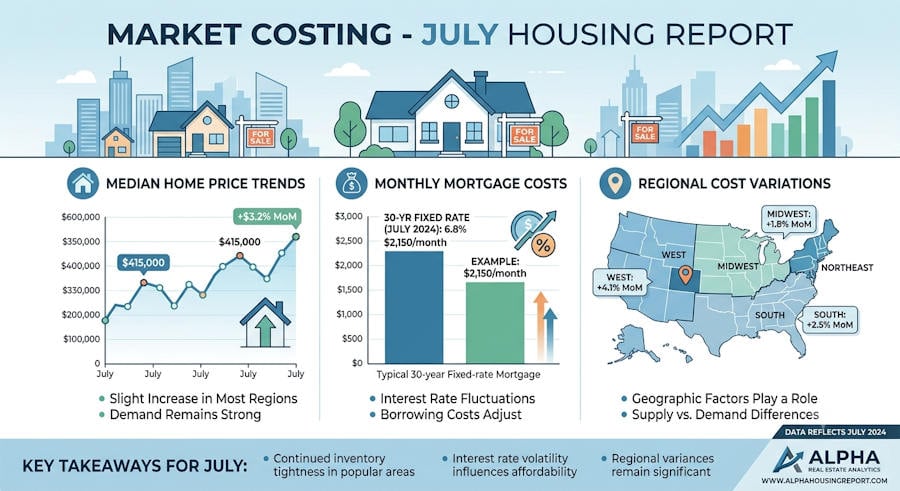
The median U.S. home-sale price rose 2.2% year over year to an all-time high of $408,776 in June. That’s according to a new report from Redfin, the real estate brokerage powered by Rocket.
U.S. existing-home sales ticked up 0.1% month over month to a seasonally adjusted annual rate of roughly 4.4 million in June—the highest level since November 2022. On a year-over-year basis, existing home sales rose 4.2% from last June. The total number of homes sold—including both existing and newly built homes—fell 0.5% in June from a month earlier but were still at their second-highest level since October 2022 and up 4.5% year over year.
Pending home sales ticked up 0.5% from a month earlier in June to their highest level since 2023, with the exception of April. Compared to a year ago, pending sales increased 4.5%. All figures in Redfin’s report are seasonally adjusted, with the exception of median sale price data and mortgage rate data.
Wealthy Coastal Buyers Drive Up Home Prices, Sales
Affluent Bay Area and South Florida homebuyers were major drivers of June’s strong housing market:
- San Francisco’s median home-sale price rose 9.2% year over year, the biggest increase of the major U.S. metro areas. Next came Pittsburgh, with a 9.1% increase, followed by West Palm Beach, where the median price rose 8.6%. A separate Redfin report shows that in San Francisco and West Palm Beach, luxury sales are fueling overall home-prices increases.
- West Palm Beach and San Francisco both posted increases of roughly 23% year over year in closed home sales, the biggest upticks of all the major U.S. metros.
- The increase in pending home sales was also driven by San Francisco, which had a 16.4% year–over-year uptick to the second-highest level in four years—the biggest increase of the metros in this analysis. In West Palm Beach, pending home sales rose 13% year over year, the third-biggest increase of the metros in this analysis.
Billionaires, executives and other ultra-wealthy Americans are moving to Florida and buying up expensive homes due to its favorable tax environment, sunny climate and beachfront lifestyle. The story is a bit different in the Bay Area, where the AI boom is driving the surge in luxury home sales and driving prices up. Redfin agents in other parts of the country, including Boston and Nashville, TN, say wealthy buyers are propping up their markets, too.
“High-end buyers are driving demand and prices in much of the country,” said Chen Zhao, Redfin’s head of economics research. “Many of the house hunters who are buying homes are the ones who can afford today’s high prices and elevated mortgage rates without busting their budget. There’s a pool of higher-income buyers who are purchasing seven-figure homes, but a lot of first-time and average move-up buyers are priced out as mortgage rates stay near 6.5%, making monthly payments challenging.”
June’s average 30-year mortgage rate was 6.49%, up slightly from a month earlier, exacerbating high prices to drive up monthly payments. High housing payments, along with economic uncertainty about things like the Iran war and inflation, pushed away some average American would-be buyers, while affluent buyers were undeterred.
It’s worth noting that sale prices are rising slower than in years past. For much of 2024, the median U.S. sale price was rising roughly 5% year over year, and during the pandemic homebuying boom in 2021-2022, it was increasing by double digits. Today’s 2% growth in prices is smaller than the 3.5% growth in U.S. wages, which means homes are becoming slightly more affordable, one factor boosting demand.
Competition For Homes Hits Highest Level in a Year
Growing homebuying demand is leading to a slightly more competitive market. More than one in five (22.2%) U.S. homes that sold in June went for more than their original list price, the highest share in over a year on a seasonally adjusted basis. That’s also part of the reason home prices ticked up in June.
New Listings Decline As Would-Be Sellers Hold Off
While home sales picked up steam as summer started, new listings ticked down about 1% month over month in June, dipping to their lowest level since December. Would-be sellers have caught on to the fact that there are many more home sellers than buyers in the market, and some have opted to hang onto their homes until the market becomes more balanced.
New listings are falling most in metros with the strongest buyer’s markets. They fell most in Dallas (-6.5%), Fort Worth, TX (-6.2%) and Jacksonville, FL (-5.5%).
June 2026 Housing Market Highlights: United States
|
June 2026 |
Month-over-month change |
Year-over-year change |
|
|
Median sale price |
$408,776 |
n/a |
2.2% |
|
Existing-home sales, seasonally adjusted annual rate |
4,397,321 |
0.1% |
4.2% |
|
Pending home sales |
349,254 |
0.5% |
4.5% |
|
Homes sold |
302,606 |
-0.4% |
4.5% |
|
New listings |
376,762 |
-0.8% |
0.1% |
|
Total homes for sale (active listings) |
1,496,490 |
0.4% |
0.8% |
|
Months of supply |
3.7 |
-0.1 |
-0.2 |
|
Median days on market |
49 |
unchanged |
1 |
|
Share of homes that sold below original list price |
59.5% |
-0.6 ppts |
-0.8 ppts |
|
Average sale-to-original-list-price ratio |
96.4% |
0.1 ppts |
0.2 ppts |
|
Pending sales that fell out of contract, as % of overall pending sales |
13.3% |
-0.2 ppts |
-0.3 ppts |
|
Monthly average 30-year fixed mortgage rate |
6.49% |
0.05 ppts |
-0.33 ppts |
June 2026 Metro-Level Highlights
The figures below are based on a list of the 50 most populous U.S. metropolitan areas. Some metros may be removed from time to time to ensure data accuracy. Refer to Redfin’s metrics definition page for explanations of metrics. All changes below represent year-over-year changes.
- Prices: Median sale prices rose most from a year earlier in San Francisco (9.2%), Pittsburgh (9.1%) and West Palm Beach, FL (8.6%). They fell most in Seattle (-4.9% ), San Jose, CA (-3.9%) and Portland, OR (-1.8%).
- Pending home sales: Pending sales rose most in San Francisco (16.4%), Austin, TX (13.2%) and West Palm Beach (13%). They fell most in Seattle (-10.8%), Houston (-10.5%) and Denver (-3.1%).
- Closed home sales: Home sales rose most in West Palm Beach (23.8%), San Francisco (23.1%) and San Diego (12.8%). They fell most in Philadelphia (-6.8%), Seattle (-5.9%) and Atlanta (-3.7%).
- New listings: New listings rose most in Philadelphia (16.7%), Anaheim, CA (15%) and St. Louis (13%). They fell most in Dallas (-6.5%), Fort Worth, TX (-6.2%) and Jacksonville, FL (-5.5%).
- Active listings: Active listings rose most in Cincinnati (15%), Boston (14.1%) and St. Louis (13.3%). They fell most in Jacksonville (-16.6%), San Francisco (-15.7%) and Miami (-13.5%).
- Days on market: In West Palm Beach, the typical home that went under contract did so in 81 days, which was 8 days faster than a year earlier—the biggest decline among the metros analyzed. Next came Jacksonville (-7 days) and Newark, NJ (-7 days). Days on market increased the most in Seattle (+9 days), Nashville, TN (+8 days) and Las Vegas (+8 days).
To read the full report, including charts and additional metro-level data, please visit: https://www.redfin.com/news/home-prices-record-high-june-2026