


![Despite Rising Home Prices, Homeownership Rates Keep Increasing [New LendingTree Report]](/media/k2/items/cache/3100be4da07dc9080d0f1b53f3799be4_L.jpg)
While U.S. home prices have come down from recent highs, they remain relatively steep. Despite this, homeownership rates have gone up in recent years.
More specifically, according to a LendingTree analysis of the latest housing data, the share of owner-occupied homes in the nation’s 50 largest metropolitan areas increased by 108 basis points from 2012 to 2022. In other words, our findings indicate that even though home values in some areas have more than doubled since 2012, more people have become homeowners.
- As of 2022, almost 43.5 million of the 70.4 million occupied housing units in the nation’s 50 largest metros were owner-occupied. The overall homeownership rate across these metros is 61.72%.
- Homeownership rates are highest in the Detroit, Minneapolis and Pittsburgh metros. The homeownership rates in these metros are 71.49%, 70.54% and 70.45%, respectively.
- Homeownership rates are lowest in the Los Angeles, New York, and San Diego metros. At 47.94%, Los Angeles is the only metro among the 50 largest where the homeownership rate is lower than 50.00%.
- From 2012 to 2022, the homeownership rate rose by 108 basis points from 60.64% to 61.72%. That’s an increase of 6,155,379 owner-occupied housing units.
You can check out our full report here: https://www.lendingtree.com/home/mortgage/homeownership-rates-study/
LendingTree's Senior Economist and report author, Jacob Channel, had this to say:
"In simplest terms, homeownership rates have gone up despite rising prices because low pandemic-era mortgage rates helped offset increased home values and incentivize homeownership. Remember that while home prices play a role in how feasible homebuying is, mortgage rates are often just as important. Over the coming years, homeownership rates may decline in some areas as the nation continues to adjust to our higher-rate housing market."

Americans report skipping meals, working overtime, and delaying medical care to afford housing
Half of U.S. homeowners and renters (49.9%) sometimes, regularly or greatly struggle to afford their housing payments, according to a new report from Redfin (redfin.com), the technology-powered real estate brokerage. Many report making sacrifices to cover their housing costs.
The most common sacrifice was taking no or fewer vacations. More than one-third of homeowners and renters (34.5%) who struggle to afford housing indicated that they skipped vacations in the past year in order to afford their monthly costs.
But many people who struggle to afford housing made more serious sacrifices: 22% skipped meals and 20.7% worked extra hours at their job. A similar share (20.6%) sold belongings.
These responses are based on a Redfin-commissioned survey conducted by Qualtrics in February 2024. The nationally representative survey was fielded to roughly 3,000 U.S. homeowners and renters. Most of Redfin’s report focuses on the 1,494 respondents who indicated that they sometimes, regularly or greatly struggle to afford regular rent or mortgage payments.
More than one of every six people (17.9%) who struggle to afford housing borrowed money from friends/family, and 17.6% dipped into their retirement savings. Over one in seven (15.6%) delayed or skipped medical treatments.
“Housing has become so financially burdensome in America that some families can no longer afford other essentials, including food and medical care, and have been forced to make major sacrifices, work overtime and ask others for money so they can cover their monthly costs,” said Redfin Economics Research Lead Chen Zhao. “Fortunately, the country’s leaders are starting to pay attention, and homebuyers may get a reprieve in June if the Federal Reserve cuts interest rates, which would bring down the cost of getting a mortgage.”
Mortgage payments are near their all-time high due to rising prices and elevated mortgage rates: The median U.S. home sale price is up about 5% from a year ago, and mortgage rates are hovering around 7%, not far from the 23-year high of roughly 8% hit in October. The typical household earns roughly $30,000 less than it needs to afford the median-priced home, and rents are on the rise again.
14% of Millennials Dipped Into Retirement Savings to Afford Housing Payments
Nearly one of every seven millennials (13.5%) who struggle to afford their housing payments have dipped into retirement savings to cover their monthly costs.
Most millennials are not retired, but housing affordability has become so strained that some are resorting to outside-the-box strategies to cover expenses. Millennials are the largest adult generation, and many are aging into their homebuying years at a time when home prices and mortgage rates are high.
The income needed to afford a starter home is up 8% from a year ago, prompting some young buyers to use family money to cover their down payment.
Baby boomers who struggle to afford housing were most likely to dip into retirement funds, with over one-quarter (27.5%) saying they did so to cover housing expenses. That makes sense, as many baby boomers are already retired, and it’s common for retirees to put their retirement savings toward housing.
Roughly 1 in 6 (15.5%) Gen Xers who struggle to afford housing dipped into retirement savings to afford monthly housing costs. The share was lowest among Gen Z respondents (6.5%), many of whom don’t yet have retirement savings.
The IRS typically taxes people who make withdrawals from their retirement accounts before the age of 59.5, but makes an exception for qualified first-time homebuyers, who are allowed to borrow up to $10,000 tax free.
Broken down by race/ethnicity, white respondents who struggle to afford housing were most likely (20.7%) to use retirement savings to cover housing costs, followed by Asian/Pacific Islander respondents (14%), Hispanic/LatinX respondents (13.6%) and Black respondents (12.6%).
Black Respondents Most Likely Work Extra Hours to Afford Housing; Gen Zers Most Likely to Sell Belongings
While pressing pause on vacations was the most common sacrifice for respondents as a whole, it wasn’t the top answer choice for every demographic. People of color and younger generations often made more serious sacrifices.
For example, Black respondents who struggle to afford housing were most likely to say they worked extra hours (25.9%) to cover their monthly costs, while Hispanic respondents were most likely to say that they sold belongings (28.2%). Skipping vacations was the most common answer among Asian/Pacific Islander respondents (43.8%) and white respondents (39.6%).
Black millennials are half as likely to own homes as white millennials, according to a separate Redfin analysis, though the racial homeownership gap exists across every generation due to decades of racist policies and discrimination.
When it came to age groups, skipping vacations was the top choice for baby boomers (42.8%), Gen Xers (36.8%) and millennials (31.3%) who struggle to afford housing. But for Gen Zers, the most common sacrifices were working extra hours, selling belongings and skipping meals, all of which clocked in at roughly 27%.
White Respondents, Baby Boomers and Homeowners Most Likely to Afford Housing Easily
Of the roughly 2,995 people who took the survey, half (50.1%) said they can easily afford their regular rent or mortgage payments, and half (49.9%) said they sometimes, regularly or greatly struggle to do so.
But the results vary by demographic. For example, 54.5% of white respondents said they can easily afford their housing payments, compared with 37.8% of Hispanic/LatinX respondents, 46.6% of Black respondents and 47.4% of Asian/Pacific Islander respondents.
Baby boomers were most likely to say they easily afford housing payments (61.9%), followed by Gen Xers (48.7%), millennials (40.2%) and Gen Zers (26.9%).
And homeowners (59.9%) were roughly twice as likely as renters (30.8%) to indicate that they easily afford their housing payments.
To view the full report, including charts and a detailed methodology, please visit: https://www.redfin.com/news/homebuying-sacrifices-survey-2024
![March Housing Report: Housing Market Takes a Step in a Buyer-Friendly Direction [Realtor.com]](/media/k2/items/cache/d0c0d38a847cd408c3bd6624c03648bf_M.jpg)
March data shows the largest share of price reductions since 2019 with 34 out of the 50 largest metros showing an uptick in drops
According to the Realtor.com® March housing report, buyers are looking at an optimistic mix of increasing inventory and an uptick in price reductions going into the Spring season. In March, the percentage of homes with price reductions increased to 15.0% - the largest share in 5 years - and the total number of homes actively for sale grew by 23.5% compared to last March (but remains well below pre pandemic levels).
“Sellers are starting to warm up to the current environment, wading into the market in increasing numbers despite market mortgage rates that are likely above their existing rate, if they have a mortgage. As a result, data shows surprisingly competitive pricing trends among sellers, especially in the lead up to this year’s Best Time to Sell, which Realtor.com® reported will be between April 14th - 20th,” said Danielle Hale, Chief Economist of Realtor.com®. “As seller optimism swells, we may see even further inventory gains later in the season that will likely create a more balanced environment for hopeful homebuyers.”
List of the 10 Metro Areas with Largest Share of Price Reductions of Total Inventory
- Tampa-St. Petersburg-Clearwater, Fla. – 27.6%
- Phoenix-Mesa-Chandler, Ariz. – 23.0%
- Austin-Round Rock-Georgetown, Texas – 22.3%
- Jacksonville, Fla. – 22.1%
- San Antonio-New Braunfels, Texas – 21.8%
- Orlando-Kissimmee-Sanford, Fla. – 20.2%
- Portland-Vancouver-Hillsboro, Ore.-Wash. – 20.1%
- Miami-Fort Lauderdale-Pompano Beach, Fla. – 19.7%
- Dallas-Fort Worth-Arlington, Texas – 19.5%
- Memphis, Tenn.-Miss.-Ark. – 19.3%
Across the country, price reductions were up compared with last year. In the South it was up 3.5 percentage points, +1.0 percentage points in the Midwest, +0.5 percentage points in the Northeast, and +0.2 percentage points in the West.
Sellers Turned Out as Home Listing Activity Continued to Climb
Between January 2024 and March 2024, the inventory of homes actively for sale was at its highest level since 2020. While inventory looks to be on the upswing, it’s important to note that the market is still down 37.9% compared to pre-pandemic levels. Like in February 2024, one price range in particular has outpaced all other price categories as home inventory between $200,000 and $350,000 grew by 30.5% compared to March 2023. A few metros experienced huge gains in active inventory for sale including Tampa (+58.3%), Orlando (53.3%), and Miami (48.2%).
Median List Price is in Flux; Up From Last Month, But Not Much has Changed from Last Year
The national median list price increased from $415,500 to $424,900 between February and March 2024. But, when compared to last year, the median list price only increased by 0.2% from March 2023. In two weeks of March, the median list price even dipped below last year’s levels. Out of the 50 largest metros, 18 saw their median list price decline compared to last year including Miami (-8.4%), Oklahoma City (-8.3%), and San Francisco (-7.6%), while Los Angeles (+15.1%), Richmond (+11.8%), and Pittsburgh (+11.6%) saw the biggest increases. As prices fluctuate, so do the requirements for financing a home. With mortgage rates hovering between 6.6% and 7% for the past three months, the cost of financing a home (assuming a 20% down payment) increased by $63 compared to last March.
March 2024 Housing Metrics – National
|
Metric |
Change over Mar 2023 |
Change over Mar 2019 |
|
Median listing price |
+0.2% (to $422,700) |
+38.9% |
|
Active listings |
+32.5% |
-37.7% |
|
New listings |
+16.5% |
-17.2% |
|
Median days on market |
-2 days (to 50 days) |
-15 days |
|
Share of active listings with price reductions |
+2.2 percentage points (to 15.0%) |
+0.0 percentage points |
Additional details and full analysis of the market inventory levels, price reductions, fluctuations and stabilization can be found in the Realtor.com® March Monthly Housing Report.
March 2024 Housing Overview of the 50 Largest Metros, Ranked by Largest Price Reduction
|
Metro Area |
Median Listing Price |
Median Listing Price YoY |
Median Listing Price per Sq. Ft. YoY |
Active Listing Count YoY |
New Listing Count YoY |
Median Days on Market |
Median Days on Market Y-Y (Days) |
Price Reduced Share |
Price Reduced Share Y-Y (Percentage Points) |
|
$419,000 |
2.2% |
3.0% |
58.3% |
29.3% |
51 |
0 |
27.6% |
8.3 pp |
|
|
$535,000 |
7.1% |
4.1% |
16.9% |
9.7% |
49 |
-1 |
23.0% |
-2.0 pp |
|
|
$550,000 |
0.0% |
2.0% |
15.8% |
19.0% |
40 |
-11 |
22.3% |
-4.5 pp |
|
|
$415,000 |
3.9% |
4.6% |
38.6% |
22.1% |
47 |
-5 |
22.1% |
4.6 pp |
|
|
$340,000 |
-1.9% |
-1.4% |
36.8% |
16.9% |
57 |
2.5 |
21.8% |
3.1 pp |
|
|
$439,000 |
-0.4% |
2.0% |
53.3% |
14.6% |
54 |
1 |
20.2% |
6.2 pp |
|
|
$605,000 |
-1.6% |
2.2% |
26.7% |
7.7% |
45 |
1.5 |
20.1% |
9.7 pp |
|
|
$549,000 |
-8.4% |
-3.6% |
48.2% |
16.6% |
58 |
-2 |
19.7% |
5.5 pp |
|
|
$440,000 |
-0.5% |
1.4% |
38.0% |
16.7% |
40 |
-5.5 |
19.5% |
3.5 pp |
|
|
$327,000 |
2.5% |
2.3% |
38.2% |
16.1% |
51 |
-1.5 |
19.3% |
4.8 pp |
|
|
$559,000 |
6.0% |
6.9% |
9.3% |
3.6% |
32 |
-3 |
18.8% |
0.6 pp |
|
|
$329,000 |
-0.3% |
-0.5% |
27.7% |
-4.8% |
67 |
9 |
17.8% |
-0.6 pp |
|
|
$321,000 |
-8.3% |
-1.5% |
22.9% |
17.4% |
45 |
-5.5 |
17.2% |
5.2 pp |
|
|
$620,000 |
-5.4% |
2.6% |
48.1% |
19.4% |
30 |
3.25 |
17.2% |
4.1 pp |
|
|
$363,000 |
0.7% |
1.3% |
23.5% |
20.1% |
43 |
-3.5 |
16.7% |
2.4 pp |
|
|
$410,000 |
2.1% |
5.8% |
19.9% |
1.2% |
38 |
-3.5 |
16.5% |
4.1 pp |
|
|
$330,000 |
5.5% |
5.8% |
23.5% |
8.3% |
42 |
-4.25 |
16.2% |
2.6 pp |
|
|
$410,000 |
0.0% |
4.0% |
22.1% |
11.9% |
41 |
-5 |
15.7% |
2.6 pp |
|
|
$380,000 |
0.8% |
6.8% |
20.2% |
9.7% |
29 |
-0.5 |
14.2% |
2.0 pp |
|
|
$470,000 |
4.4% |
5.8% |
-33.1% |
8.4% |
38 |
-15 |
13.7% |
-6.4 pp |
|
|
$315,000 |
2.3% |
3.6% |
14.5% |
5.9% |
40 |
4 |
13.6% |
0.6 pp |
|
|
$391,000 |
4.8% |
6.4% |
14.3% |
2.2% |
34 |
-4 |
13.2% |
2.3 pp |
|
|
$290,000 |
4.0% |
5.3% |
27.6% |
12.6% |
50 |
-1 |
13.1% |
-0.1 pp |
|
|
$599,000 |
7.1% |
7.1% |
7.5% |
15.2% |
47 |
-7 |
13.0% |
0.4 pp |
|
|
$240,000 |
11.6% |
9.9% |
10.8% |
1.3% |
55 |
-9 |
12.9% |
0.8 pp |
|
|
$335,000 |
-3.8% |
2.4% |
11.6% |
6.5% |
36 |
-7 |
11.3% |
1.1 pp |
|
|
$450,000 |
0.0% |
5.9% |
6.1% |
18.1% |
42 |
-9.5 |
11.2% |
-1.5 pp |
|
|
$425,000 |
-6.6% |
-4.0% |
8.1% |
20.7% |
51 |
-19.75 |
11.2% |
2.9 pp |
|
|
$350,000 |
-4.7% |
6.2% |
28.1% |
17.0% |
37 |
-1 |
11.1% |
3.0 pp |
|
|
$635,000 |
1.3% |
4.2% |
16.9% |
32.5% |
36 |
-6.5 |
11.1% |
1.0 pp |
|
|
$350,000 |
6.6% |
7.2% |
-1.3% |
1.6% |
43 |
-6.5 |
11.0% |
0.0 pp |
|
|
$230,000 |
8.4% |
9.2% |
0.4% |
2.4% |
42 |
-1.5 |
11.0% |
1.5 pp |
|
|
$998,000 |
5.1% |
11.1% |
26.3% |
25.9% |
32 |
-5 |
10.9% |
1.2 pp |
|
|
$292,000 |
4.7% |
4.8% |
14.2% |
4.9% |
39 |
-7.5 |
10.3% |
0.8 pp |
|
|
$240,000 |
1.2% |
1.7% |
3.6% |
4.1% |
42 |
-3.5 |
9.8% |
-2.3 pp |
|
|
$880,000 |
6.9% |
10.0% |
0.9% |
7.3% |
24 |
-4 |
9.7% |
1.3 pp |
|
|
$445,000 |
-1.4% |
-0.2% |
24.3% |
16.8% |
34 |
-4 |
9.5% |
2.3 pp |
|
|
$450,000 |
11.8% |
8.7% |
8.8% |
-9.4% |
44 |
3 |
9.1% |
1.3 pp |
|
|
1150000 |
15.1% |
8.1% |
5.4% |
17.8% |
42 |
-3.5 |
9.0% |
-0.4 pp |
|
|
$768,000 |
-2.7% |
1.4% |
20.3% |
19.5% |
29 |
-3 |
8.7% |
-0.8 pp |
|
|
$604,000 |
0.8% |
6.6% |
2.2% |
3.2% |
31 |
-3 |
8.7% |
0.9 pp |
|
|
$999,000 |
-7.6% |
-1.2% |
13.4% |
21.7% |
27 |
-6.5 |
8.6% |
-0.3 pp |
|
|
$365,000 |
-0.3% |
5.2% |
9.9% |
12.4% |
29 |
-3.5 |
7.9% |
0.7 pp |
|
|
$375,000 |
6.4% |
7.3% |
-7.7% |
2.0% |
33 |
-7 |
7.8% |
-1.8 pp |
|
|
$760,000 |
8.8% |
15.2% |
-4.3% |
2.6% |
50 |
-5 |
6.8% |
-0.4 pp |
|
|
$500,000 |
-2.8% |
-1.7% |
0.1% |
12.1% |
35.5 |
-5.75 |
6.3% |
0.6 pp |
|
|
1481000 |
-0.9% |
1.1% |
2.2% |
21.5% |
22 |
-5 |
5.8% |
-1.6 pp |
|
|
$270,000 |
9.7% |
9.6% |
4.2% |
3.7% |
38 |
-6.5 |
5.3% |
-0.3 pp |
|
|
$400,000 |
-0.7% |
4.7% |
6.1% |
6.5% |
37 |
8 |
5.1% |
0.6 pp |
|
|
$280,000 |
8.7% |
7.1% |
-4.0% |
9.0% |
22 |
-2 |
4.3% |
-2.5 pp |
Methodology
Realtor.com housing data as of March 2024. Listings include the active inventory of existing single-family homes and condos/townhomes/row homes/co-ops for the given level of geography on Realtor.com; new construction is excluded unless listed via an MLS that provides listing data to Realtor.com. Realtor.com data history goes back to July 2016. 50 largest U.S. metropolitan areas as defined by the Office of Management and Budget (OMB-202003).

When it comes to the concept of disruptions in this world, we tend to focus on all the new digital tools that are creating ripples in headlines. From generative AI to digital currency, these digital disruptions are definitely leaving their impact. But instead, the focus of today should be on the very concept of disruption itself, not just digital disruption.
The word “disruption” is a key stumbling point for many. Having worked with businesses and organizations of varying sizes worldwide, what I have discovered is that while most have a heavy focus on digital disruptions, others do not consider the many other disruptions this world is throwing our way.
To help the world while leveraging disruptions, we must better understand the term “transformation” as well. What we are aiming to do is transform the world instead of merely changing it. In today’s world of accelerating disruptions of any kind, if you are only aiming to change something, you are falling further and further behind.
Transformation and Change Have Never Been the Same
To account for those aforementioned disruptions, being agile is important. But no matter how agile you are, reacting quickly is not an effective strategy. You want to implement a strategy that takes into consideration the long-term vitality of your business and one that betters humankind!
We now need to become much more Anticipatory than ever before, using Hard Trends based on future facts to anticipate disruptions before they disrupt. This is how you create more long-term significance in your organization and the world overall.
I always explain this in the form of a two-sided strategic coin. Agility represents a defensive strategy on one side of the strategic coin, and anticipation represents the offensive side. Leveraging disruptions to create transformation is an Anticipatory competency that is vital in many ways. This competency is quite different from making changes to your business strategy to respond to said disruptions with agility.
When you create a change, you generally are making some type of nominal adjustment. A transformation has a much larger impact on both your organization and the world. We want to make differences that better the lives of our current and future customers.
Create Transformation to Address Problems of Sustainability
If we do not become Anticipatory and look for ways to transform our world instead of trying to change them in an agile way, we will have an increasing number of problems to solve.
Many have said that when dealing with a problem, sometimes the answer is right in front of your eyes. This is true, but I have found that in many cases, the answer may be in the opposite direction.
The Law of Opposites is an Anticipatory competency that helps you and your team see opportunity in the most inconspicuous places. This law encourages you to look in the opposite direction to find solutions to problems that seem overwhelming and often impossible to solve.
SpaceX is a company that leveraged this Anticipatory competency and created a transformation in an industry that others, even NASA themselves, thought to be unrealistic.
Rockets launched into space leave a trail of space junk that, in most cases, burns up upon re-entry into the Earth’s atmosphere. Most of the rockets proved to be a one-time use. Elon Musk and his team at SpaceX went the route of building reusable rockets. This nearly eliminates the issue of space junk and creates a level of sustainability for their organization and the aerospace industry. They are the first to do this and have become a staple in space exploration, launching and servicing satellites, and now are involved in our next moon mission.
So, how did the Law of Opposites help this prolific company create a transformation in their industry?
Instead of looking at the obvious problem, they took a look in the opposite direction. The issues, including cost, that were plaguing space travel were not the right problem. The problem was how to continue space exploration in the most sustainable way. In turn, SpaceX built something sustainable for themselves and our world.
Actionable Insights for Your Organization
I want your organization to be able to sustain growth and its significance in the world. Likewise, I want your organization to be a beacon of transformation that benefits humankind in whatever way you can!
It all starts on a very simple and small scale. I encourage everyone to be both agile and Anticipatory in thinking and practice to create transformations.
As I said earlier and will say again, agility and anticipation are like two sides of a strategic coin. The agility side represents playing defense — a fast, reactive strategy that is good for changes that seem to come out of nowhere. The other half of the strategy coin is anticipation — playing offense, anticipating disruptions before they disrupt, and as the case with SpaceX, going opposite to pre-solve problems before they occur. Both are needed to leverage disruptions to your organization’s advantage.
Will your organization transform your processes, products, and services to build a sustainable practice? Or will you stick to changing them on an as-needed basis? The answer is a Soft Trend — it is up to you to take charge!

Sometimes you say something and you later regret having said it. Sometimes you think you are helping, but then say something that only makes things worse! We have all been in or seen that situation and understand how it happens. But when the person who says it is in a position of power, it can really have drastic consequences. In the past few days, we saw just that, the president was out on a campaign event and said that he was pretty sure the FED would be cutting rates soon. While he smiled, the markets knew that this was going to become an issue!
The FED has always tried to maintain at least the appearance of being apolitical and independent. The job is to navigate the economy without yielding to political pressure. While not easy, it becomes even more challenging in a presidential election year and it’s the president suggesting that rate cuts are soon to follow. The knee jerk reaction in the markets and likely the FED is to now anticipate even a longer pause in any potential rate cuts to give the appearance of not succumbing to political pressure from the president. When you add that to the surprising data we have seen over the last couple of weeks, future rate cuts may very well get pushed pretty far down the road. This week we have the jobs report on Friday and another strong report could significantly impact the markets even further than expected.
We also have seen a great deal of conversation about the NAR settlement across the board. I caution everyone to remember that NOTHING has been signed off by a judge yet, so we still have all the specifics going forward. While there is certainly a framework, it’s not a done deal. We also saw the first response from the mortgage side of the equation as FHA 2024-12 was published last week and said that from the FHA point of view, the seller may still pay the buyer’s agent if it is normal and customary in that market and that that it would NOT be considered part of a seller’s concession. So at least there is that. Clearly, there is much more to be addressed on that front down the road.
We have continuing and initial jobless claims today and the March jobs report Friday morning. Could certainly be market moving, so be aware and don’t be blindsided by the news! Questions or comments: This email address is being protected from spambots. You need JavaScript enabled to view it.

Freddie Mac (OTCQB: FMCC) today released the results of its Primary Mortgage Market Survey® (PMMS®), showing the 30-year fixed-rate mortgage (FRM) averaged 6.82 percent.
"Mortgage rates showed little movement again this week, hovering around 6.8 percent,” said Sam Khater, Freddie Mac’s Chief Economist. “Since the start of 2024, the 30-year fixed-rate mortgage has not reached seven percent but has not dropped below 6.6 percent either. While incoming economic signals indicate lower rates of inflation, we do not expect rates will decrease meaningfully in the near-term. On the plus side, inventory is improving somewhat, which should help temper home price growth.”
News Facts
- The 30-year FRM averaged 6.82 percent as of April 4, 2024, up from last week when it averaged 6.79 percent. A year ago at this time, the 30-year FRM averaged 6.28 percent.
- The 15-year FRM averaged 6.06 percent, down from last week when it averaged 6.11 percent. A year ago at this time, the 15-year FRM averaged 5.64 percent.
The PMMS® is focused on conventional, conforming, fully amortizing home purchase loans for borrowers who put 20 percent down and have excellent credit. For more information, view our Frequently Asked Questions.
Freddie Mac’s mission is to make home possible for families across the nation. We promote liquidity, stability, affordability and equity in the housing market throughout all economic cycles. Since 1970, we have helped tens of millions of families buy, rent or keep their home. Learn More: Website

Millennials have surged ahead to become the largest group of home buyers, marking a significant shift in the housing market’s demographic landscape, according to the latest report from the National Association of Realtors®.
The 2024 Home Buyers and Sellers Generational Trends report, which examines the similarities and differences among recent home buyers and sellers across generations1, found that the combined share of millennials, both younger (ages 25 to 33) and older (ages 34 to 43), now make up a combined 38% of the home buying market, a substantial increase from 28% last year. Baby boomers, comprising both younger boomers (ages 59 to 68) and older boomers (ages 69 to 77), saw their share decrease from 39% to 31%, relinquishing their position as last year’s largest demographic of home buyers.
“The generational tug-of-war between millennials and baby boomers continued this year, with millennials rebounding to capture the largest share of home buyers,” said Dr. Jessica Lautz, NAR deputy chief economist and vice president of research. “This notable rise is attributed to both younger millennials stepping into homeownership for the first time and older millennials transitioning to larger homes that suit their evolving needs.”
The report underscored a rise in first-time buyers across many generations, with 32% of all buyers purchasing for the first time, an increase from 26% last year. Leading the charge were younger millennials, whose proportion of first-time buyers increased from 70% to 75% over the past year. Forty-four percent of older millennials and 24% of Generation X (ages 44-58) were first-time buyers.
In parallel, the emergence of Generation Z (ages 18-24) in the housing market paints a picture of diversity and independence. While this cohort only accounted for 3% of all buyers, an impressive 31% of Gen Z purchasers were single females – a proportion significantly higher than that observed in any other generation.
“Gen Z buyers are entering the housing market, and their demographics are emerging distinctly from other age groups,” Lautz said. “More than half are single buyers, outpacing all age groups of single men and single women, and they are also most likely to identify as LGBTQ+.”
Despite these shifts in buyer trends, baby boomers remained the largest home-seller generation, accounting for 45% of all sellers in 2023. The tenure of homeownership before making a sale varied significantly by generation. While the median among all buyers was a 10-year stay before selling, older millennials typically sold their homes after just six years, contrasting sharply with Gen X, baby boomers and the Silent Generation (ages 78-98), who typically stayed in their homes for 15 years.
“Baby boomers continue to dominate the home-selling market as they make pivotal decisions regarding their retirement living situations, whether it’s right-sizing or moving closer to loved ones,” Lautz said. “Benefiting from longer periods of homeownership compared to other generations, boomers approach these transactions with substantial equity, enabling strategic housing trades.”
In the face of changing market dynamics, the enduring appeal of homeownership remains strong. This year’s report revealed that 82% of all buyers consider a home purchase a good financial investment, with this sentiment especially pronounced among younger millennials, 86% of whom echo this positive outlook.
Across all generations, nine out of ten buyers indicated they would either definitely (75%) or probably (15%) enlist their real estate agent’s services again or recommend them to others. Similarly, among sellers, 87% expressed they were likely to reuse or refer their agent.
“The universal value of owning a home transcends every generation, serving as a cornerstone for both personal prosperity and community development,” said NAR President Kevin Sears, broker-partner of Sears Real Estate in Springfield, Massachusetts. “In navigating the complexities of the market, buyers and sellers continue to rely on agents who are Realtors® for their expertise and guidance, underscoring the invaluable service they provide in bringing dreams of homeownership to life.”
Methodology
NAR mailed a 129-question survey in July 2023 using a random sample weighted to be representative of sales on a geographic basis to 189,750 recent home buyers. Buyers had to have purchased a primary residence home between July 2022 and June 2023. The survey received 6,817 responses from primary residence buyers. After accounting for undeliverable questionnaires, the survey had an adjusted response rate of 3.6%.
All information in this report is characteristic of the 12-month period ending June 2023, with the exception of income data, which are reported for 2022. In some sections, comparisons are provided for results obtained in previous surveys. Not all results are directly comparable due to changes in questionnaire design and sample size.

There is so much talk about generative AI today, it has become somewhat of a hot-button issue among working professionals and business leaders.
We are witnessing firsthand the power of generative AI with applications like ChatGPT, Gemini, and other content-creating software. On Meta, Instagram, and other social media sites, there are works of digital art being created by generative AI applications like Midjourney, Canva and DALL·E 3 to name a few.
But despite the fact that many are already implementing it while others are kept up at night about it, even I have to beg the question: So what?
Why does the Hard Trend future certainty of generative AI matter so much to society, both professionally and personally? Is there real danger I should be aware of regarding this disruptive digital application? How can it make my life better at work or at home?
Again, generative AI is here to stay. So what?
Generative AI Is Sculpting Our Professional Landscape
What we saw happen in 2023 and years prior was an exponential growth of generative AI by way of content creation applications. Last year, the average person went from a very rough understanding of “artificial intelligence” itself to worrying that AI will replace them in their job, put them out of business, or help their child cheat in school.
But as I mentioned above, AI itself and more specifically generative AI is not going to slow down — it is only going to accelerate! And as a result, we are going to see massive change in all industries and career fields.
Let’s take the teaching and education sector and generative AI’s impact on it. If you survey any number of teachers or administrators right now, you may find that for the most part, they fear generative AI. This fear pertains to cheating on assignments and tests, and their belief that students will be worse off as a result.
Yet because our first reaction is fear, we tend to hold ourselves back from seeing the benefits and, thus, prevent an Anticipatory Mindset from replacing an agile one. If we accept that generative AI is a Hard Trend future certainty, we will be able to see it as nothing more threatening than a calculator was to longhand math!
Generative AI Plus Niche Data Equal Personalized Education
Generative AI should not be banned from the classroom. Without question, it should be leveraged for good!
One of the most prolific developments in generative AI and the education sector is the ability for a more personalized education experience for every student. How is this possible? Well, think of all the data any given individual puts into the digital world.
There have been breakthroughs in specialized generative algorithms that are being powered by big data. If you consider all of the personalized data of every individual, think of how that can be leveraged for educational purposes. These can be advancements including AI applications that help students comprehend the class textbook to something that can rephrase questions on a quiz so that a student with a learning disability succeeds in their own way.
What this results in is teachers being able to focus on personalizing the experience in the classroom even further, focusing instead on the higher cognitive domain of each student. I relate this concept back to the invention of the calculator and in more recent years, the computer and now tablet. The calculator helped us do basic addition faster and in turn, teachers focused on making sure students could visualize what it was doing. The computer let us write papers with ease so teachers could focus more on their students learning the importance of the material they are writing about.
Now, generative AI will help with personalizing educational experiences to each individual learner. This is the perfect opportunity for teachers to then be able to personalize their interaction with each student much easier, making every learner feel welcome and find success in learning.
Anticipation and the New Frontier of Generative AI
Staying on the topic of education, even though generative AI is here and you may say to yourself, “So what? What is the big deal?” — it is imperative that you anticipate what is to come with it.
So many find themselves having to adapt, which is what breeds the fear of change. We feel out of control when change happens to us. But the concept of change is the only constant in every industry; the question is whether you will take charge and be the force of transformation on your own.
Adaptation is not what we should be doing. We should be taking this moment to anticipate what is coming our way regarding developments in generative AI. How do we anticipate the future of generative AI right now? Look at what is already there as a Hard Trend future certainty and think, “If this type of generative AI is already capable of doing certain tasks, it no doubt will be able to do more.”
Likewise, especially in education, think critically! Think exponentially. What are some basic tasks that are filling the days in your classroom and exhausting you? What would make reaching students easier? What would make students’ lives easier?
Generative AI is and will continue to simplify our lives, but that does not mean we have to grow complacent. Mastering generative AI allows you to better lead a business, teach a classroom, and be human in it all.
Eager to master generative AI and stay ahead of the curve? Get your hands on Daniel Burrus’ AI Tools and Recommendations Report. Visit www.aiStrategyReport.com now and step into the future prepared and informed. Download today and transform anticipation into action!

If you look at social media at all, you would think the real estate world has come to an end. As usual, those who largely make a living generating clicks as opposed to clients are running crazy with their views on the NAR settlement with the DOJ. The problems come from the fact that many people actually believe what they have read and are panicking themselves and others over things that are NOT set in stone
What you need to focus on is current reality. NOTHING is done until a judge agrees to whatever settlement terms are placed on the table. That said, as of this writing, there isn’t even a firm time for a judge to issue any type of comment, much less approve a deal. The next part of this is that NOTHING about this deal prohibits anyone or anything outside of NAR from operating as they always have.
While I am not an attorney, there are many who are that are offering widely different interpretations of this agreement, and I am just sharing my thoughts from what I have read, and that leads me to say that we may have to add a few disclosures, share some information differently than we currently do; and the possibility does exist that some form of buyer’s agency agreement will need to be executed, the basic structure won’t change all that much.
One thing I want to address is that I disagree that this will lower the cost of housing. In much the same way FSBO deals have proven not to lower the cost of housing, any of these current changes won’t likely do so in any meaningful way, unless more homes are built and available for sale, I don’t see any downward pressure on home prices in the near future, and certainly not as a result of anything I have read in the agreement put forward.
There is much more to unpack here, but it is simple to say, just go out and list and sell homes, do loans for those that you can help, and wait until you see actual documents approved by a judge, the DOJ, and the state in which you work before making any choices. Besides, we can only go with what we know, and there is nothing that has been finalized yet so just keep working
Questions or comments: This email address is being protected from spambots. You need JavaScript enabled to view it.

-- Freddie Mac (OTCQB: FMCC) today released the results of its Primary Mortgage Market Survey® (PMMS®), showing the 30-year fixed-rate mortgage (FRM) averaged 6.79 percent.
“Mortgage rates moved slightly lower this week, providing a bit more room in the budgets of some prospective homebuyers,” said Sam Khater, Freddie Mac’s Chief Economist. “We also are seeing encouraging data on existing home sales, which reflects improving inventory. Regardless, rates remain elevated near seven percent as markets watch for signs of cooling inflation, hoping that rates will come down further.”
News Facts
- The 30-year FRM averaged 6.79 percent as of March 28, 2024, down from last week when it averaged 6.87 percent. A year ago at this time, the 30-year FRM averaged 6.32 percent.
- The 15-year FRM averaged 6.11 percent, down from last week when it averaged 6.21 percent. A year ago at this time, the 15-year FRM averaged 5.56 percent.
-
The PMMS® is focused on conventional, conforming, fully amortizing home purchase loans for borrowers who put 20 percent down and have excellent credit. For more information, view our Frequently Asked Questions.
Freddie Mac’s mission is to make home possible for families across the nation. We promote liquidity, stability, affordability and equity in the housing market throughout all economic cycles. Since 1970, we have helped tens of millions of families buy, rent or keep their home. Learn More: Website
More...

Over one-third of home purchases in February were made in all cash—not far from the record high
The median down payment for U.S. homebuyers was $55,640 in February, according to a new report from Redfin (redfin.com), the technology-powered real estate brokerage. That’s up 24.1% from $44,850 a year earlier—the largest annual increase in percentage terms since April 2022.
The typical homebuyer’s down payment last month was equal to 15% of the purchase price, up from 10% a year earlier.
This is based on a Redfin analysis of county records across 40 of the most populous U.S. metropolitan areas going back through 2011.
“Homebuyers are doing whatever they can to pull together a large down payment in order to lower their monthly payments moving forward,” said Rachel Riva, a Redfin real estate agent in Miami. “The smallest down payment I’ve seen recently is 25%. I had one client who put down 40%.”
Home prices rose 6.6% year over year in February, which is part of the reason down payments increased; a higher home price naturally leads to a higher down payment because the down payment is a percentage of the home price. But elevated housing costs (from both high prices and high mortgage rates) are also incentivizing buyers to take out larger down payments.
A bigger down payment means a smaller total loan amount, and a smaller loan amount means smaller monthly interest payments. For example, a buyer who purchases today’s median-priced U.S. home ($374,500) and puts 15% down would have a monthly payment of $2,836 at the current 6.79% mortgage rate. A buyer who puts 10% down on that same home with that same rate would have a monthly payment of $2,968. That’s $132 more per month, which adds up over the course of a mortgage. Mortgage rates are down from their October peak of roughly 8%, but are still more than double the all-time low hit during the pandemic.
Over 1 in 3 Home Purchases Are Made With Cash—a Near Record Share
Over one-third (34.5%) of U.S. home purchases in February were made with all cash, up from 33.4% a year earlier. That’s just shy of the 34.8% decade-high hit in November, and isn’t far below the record high of 38% hit in 2013.
Redfin defines an all-cash purchase as a home purchase with no mortgage loan information on the deed.
Some homebuyers are paying in cash for the same reason others are taking out large down payments: elevated mortgage interest rates. While a large down payment helps ease the sting of high rates by reducing monthly interest payments, an all-cash purchase removes the sting altogether because it means a buyer isn’t paying interest at all.
Most buyers, though, can’t afford to pay in cash, and many can’t afford a big down payment either. First-time buyers, especially, are at a disadvantage in today’s market. That’s because they don’t have equity from the sale of a previous home to bolster their down payments, and are often competing against all-cash offers, which sellers tend to favor. Many all-cash offers come from investors, who were buying up more than one-quarter of the country’s low-priced homes as of the end of last year. Overall, though, investors are purchasing far fewer homes than they were during the pandemic housing boom.
“High mortgage rates are widening the wealth gap between people of different races, generations and income levels,” said Redfin Economics Research Lead Chen Zhao. “They’ve added fuel to the fire lit by surging home prices during the pandemic, creating a reality where in many places, wealthy Americans are the only ones who can afford to buy homes. Meanwhile, people who are priced out of homeownership are missing out on a major wealth building opportunity, which could have financial implications for their children and even their children’s children.”
FHA Loans More Popular Than They Were During Pandemic Because the Market Is Less Competitive
Roughly one in six (15.5%) mortgaged U.S. home sales used an FHA loan in February, up from 14.9% a year earlier and just shy of the 16.3% four-year high hit a month earlier. FHA loans are more common than they were during the pandemic homebuying boom (they represented 12.1% of mortgaged sales in February 2022) because the market today is less competitive.
Roughly one in 14 (7%) mortgaged home sales used a VA loan in February, down from 8% a year earlier. The share of home sales using a VA loan typically doesn’t change much over time, though it fluctuated more than usual during the topsy-turvy pandemic market.
Conventional loans are the most common type, representing over three-quarters (77.5%) of mortgaged home sales in February, up slightly from 77.1% a year earlier. Jumbo loans—used for higher loan amounts and popular among luxury buyers—represented 5.3% of mortgaged sales, compared with 4.7% a year earlier.
Metros with biggest increases/decreases in down payment amounts
In Las Vegas, the median down payment jumped 60.9% year over year—the largest increase among the metros Redfin analyzed. Next came San Diego (49.8%), Charlotte, NC (47.4%), Virginia Beach, VA (45%) and Newark, NJ (32.2%). Down payments only fell in two metros: Milwaukee (-13.9%) and Pittsburgh (-0.4%).
Metros with highest/lowest down payment percentages
In San Francisco, the median down payment was equal to 25% of the purchase price—the highest among the metros Redfin analyzed. It was followed by San Jose, CA (24.9%) and Anaheim, CA (21.9%). The following metros all had median down payments of 20%: Fort Lauderdale, FL, Los Angeles, Miami, Montgomery County, PA, New Brunswick, NJ, New York, Oakland, CA, Sacramento, CA, San Diego, Seattle and West Palm Beach, FL.
Down payment percentages were lowest in Virginia Beach (1.8%), Detroit (5%), Pittsburgh (5%), Baltimore (5%) and Philadelphia (7.3%).
While the Bay Area has among the most expensive home prices, it also has a high concentration of wealthy residents, many of whom can afford large down payments. Meanwhile, Virginia Beach is at the bottom of the list because it has a high concentration of veterans, many of whom take out VA loans, which require little to no down payment.
Metros where all-cash purchases are most/least common
In Jacksonville, FL, 54.4% of home purchases were made in cash—the highest share among the metros Redfin analyzed. Next came West Palm Beach (53.4%), Cleveland (48.8%), Fort Lauderdale (46.2%) and Atlanta (46.1%). These metros are popular among investors, who often pay in cash.
All-cash purchases were least common in San Jose (18%), Oakland (21.6%), San Diego (21.7%), Los Angeles (23%) and Providence, RI (23.3%).
Metros with biggest increases/decreases in share of all-cash purchases
In Atlanta, 46.1% of home purchases were made in cash, up 12.5 percentage points from a year earlier—the largest increase among the metros Redfin analyzed. It was followed by Jacksonville (8 ppts), Oakland (6.2 ppts), Portland, OR (5.7 ppts) and New Brunswick (5.2 ppts).
In Columbus, OH, 28.5% of home purchases were made in cash, down 6.1 percentage points from a year earlier—the largest decrease among the metros Redfin analyzed. Next came Cincinnati (-4.4 ppts), Philadelphia (-3.3 ppts), Chicago (-3.3 ppts) and Phoenix (-2.8 ppts).
To view the full report, including charts and metro-level data, please visit:
https://www.redfin.com/news/all-cash-homebuyers-february-2024

The typical U.S. monthly housing payment hit an all-time high of $2,721 during the four weeks ending March 24, up 10% from a year earlier, according to a new report from Redfin (redfin.com), the technology-powered real estate brokerage.
Housing payments are at a record high because of the one-two punch of elevated mortgage rates and rising home prices. Mortgage rates remain elevated near 7%, and the median home-sale price is up 5% year over year to roughly $375,000, just about $9,000 shy of June 2023’s record high.
Many sellers are trying to take advantage of rising prices by listing their home. New listings are up 15%, the biggest increase in nearly three years, and the total number of homes for sale is up 6%, the biggest increase in nearly one year.
Increased supply is bringing back some demand, which is the main reason price growth remains robust. Mortgage-purchase applications are up 14% from a month ago, and pending home sales are just 1% lower than they were a year ago, the smallest decline since the beginning of the year.
“High mortgage rates aren’t deterring buyers as much as they were last year; a lot of people want to get in now before prices go up more,” said Miami Redfin agent Rachel Riva. “All of my recent listings have gone under contract in under 10 days, and most of them have received multiple offers. Buyers are lessening the impact of elevated rates in a few ways: Some are making high down payments to lower their monthly payments, and some are willing to take on a high rate now in hopes of refinancing when and if rates come down.”
There are a few signs that price growth could soften a bit in the coming months. Nearly 6% of home sellers dropped their asking price this week, on average, the highest share of any March on record. Months of supply hit its highest level of any March since 2020–when the onset of the pandemic ground the housing market to a halt–indicating that the market is becoming more balanced.
Leading indicators
|
Indicators of homebuying demand and activity |
||||
|
Value (if applicable) |
Recent change |
Year-over-year change |
Source |
|
|
Daily average 30-year fixed mortgage rate |
6.91% (March 27) |
Down from 7.11% a week earlier |
Up from 6.44% |
Mortgage News Daily |
|
Weekly average 30-year fixed mortgage rate |
6.87% (week ending March 21) |
Up from 6.74% a week earlier |
Up from 6.42% |
Freddie Mac |
|
Mortgage-purchase applications (seasonally adjusted) |
Essentially unchanged from a week earlier; up 14% from a month earlier (as of week ending March 22) |
Down 16% |
Mortgage Bankers Association |
|
|
Redfin Homebuyer Demand Index (seasonally adjusted) |
Up 2% from a month earlier (as of week ending March 24) |
Down 8% |
Redfin Homebuyer Demand Index, a measure of requests for tours and other homebuying services from Redfin agents |
|
|
Google searches for “home for sale” |
Up 6% from a month earlier (as of March 25) |
Down 5% |
Google Trends |
|
|
Touring activity |
Up 28% from the start of the year (as of March 25) |
At this time last year, it was up 21% from the start of 2023 |
ShowingTime, a home touring technology company |
|
Key housing-market data
|
U.S. highlights: Four weeks ending March 24, 2024 Redfin’s national metrics include data from 400+ U.S. metro areas, and is based on homes listed and/or sold during the period. Weekly housing-market data goes back through 2015. Subject to revision. |
|||
|
Four weeks ending March 24, 2024 |
Year-over-year change |
Notes |
|
|
Median sale price |
$374,500 |
4.6% |
|
|
Median asking price |
$405,451 |
5.1% |
|
|
Median monthly mortgage payment |
$2,721 at a 6.87% mortgage rate |
9.8% |
Record high |
|
Pending sales |
85,048 |
-1.1% |
Smallest decline in over 2 months |
|
New listings |
92,087 |
14.8% |
Biggest increase since June 2021 |
|
Active listings |
807,227 |
6.3% |
Biggest increase since May 2023 |
|
Months of supply |
3.3 months |
+0.4 pts. |
4 to 5 months of supply is considered balanced, with a lower number indicating seller’s market conditions |
|
Share of homes off market in two weeks |
42.3% |
Essentially unchanged |
|
|
Median days on market |
40 |
-2 days |
|
|
Share of homes sold above list price |
26.8% |
Up from 26% |
|
|
Share of homes with a price drop |
5.8% |
+1.6 pts. |
|
|
Average sale-to-list price ratio |
98.8% |
+0.2 pts. |
|
|
Metro-level highlights: Four weeks ending March 24, 2024 Redfin’s metro-level data includes the 50 most populous U.S. metros. Select metros may be excluded from time to time to ensure data accuracy. |
|||
|
Metros with biggest year-over-year increases |
Metros with biggest year-over-year decreases |
Notes |
|
|
Median sale price |
West Palm B each, FL (20.7%) San Jose, CA (17.6%) Miami (16.1%) Detroit (15%) New Brunswick, NJ (14.5%) |
San Antonio, TX (-0.3%) |
Declined in just 1 metro |
|
Pending sales |
San Jose, CA (25.1%) San Francisco (20.1%) Cincinnati (11.6%) Anaheim, CA (9.9%) Seattle (8.2%) |
Atlanta (-15.4%) Houston (-13%) San Antonio, TX (-12.7%) West Palm Beach, FL (-12.5%) Miami (-10.7%) |
Increased in roughly half of the metros |
|
New listings |
San Jose, CA (41.8%) Sacramento, CA (38%) Phoenix (31.7%) Las Vegas (27.3%) Austin, TX (26%) |
Atlanta (-6.6%) Chicago (-2.9%) |
Declined in just 2 metros |
To view the full report, including charts, please visit:
https://www.redfin.com/news/housing-market-update-housing-costs-inventory-increase

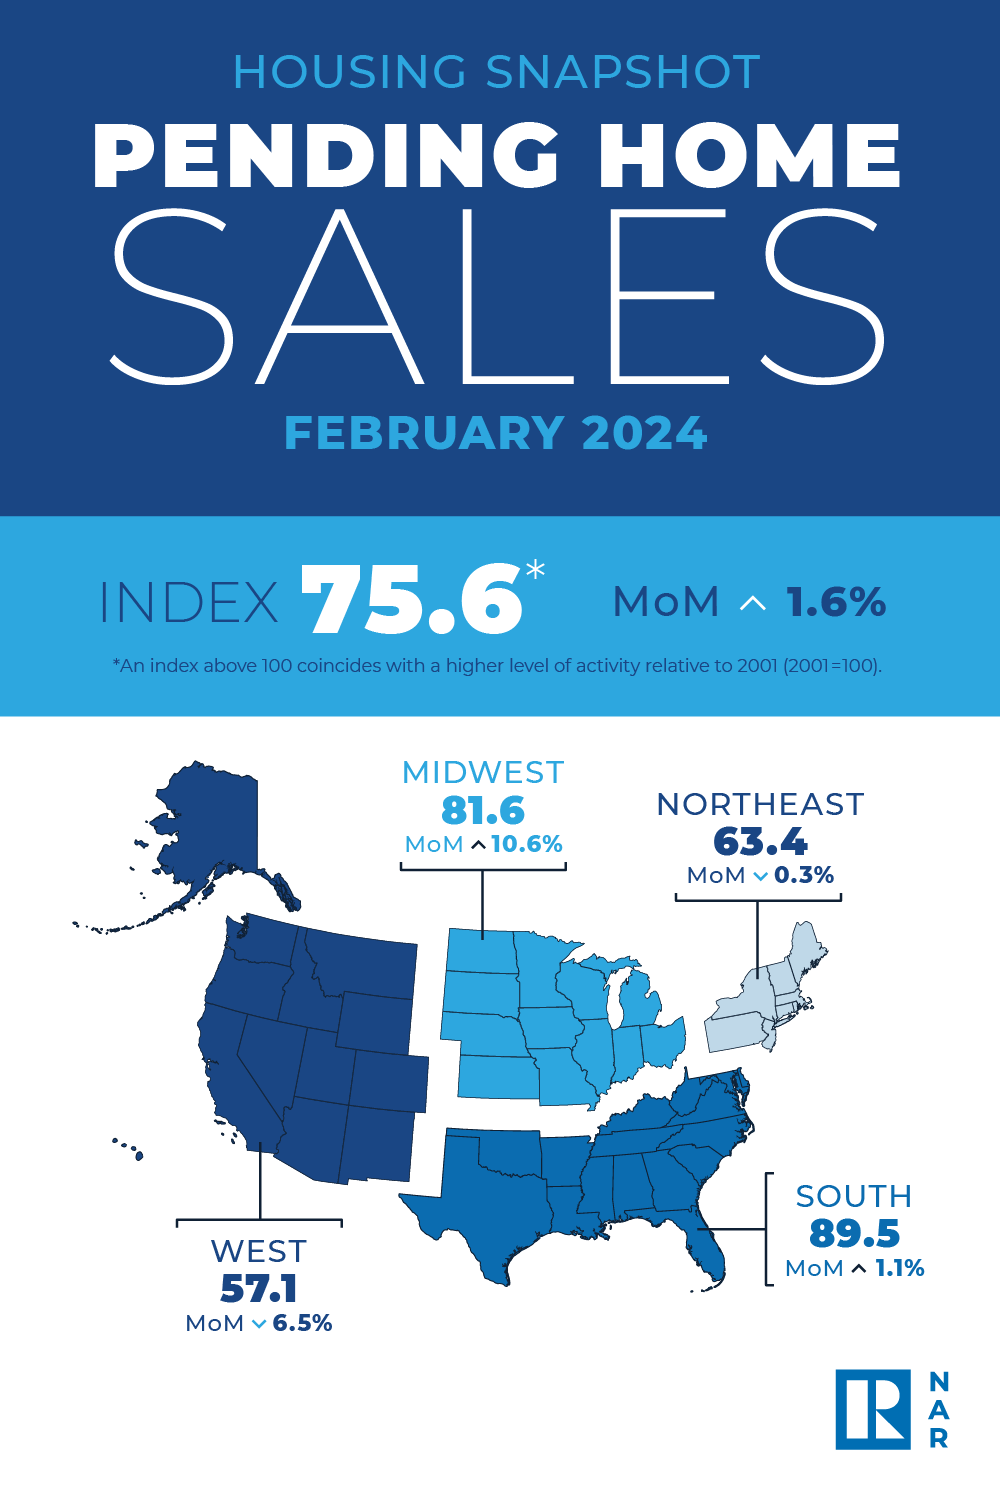
Pending home sales in February grew 1.6%, according to the National Association of Realtors®. The Midwest and South posted monthly gains in transactions while the Northeast and West recorded losses. All four U.S. regions registered year-over-year decreases.
The Pending Home Sales Index (PHSI)* – a forward-looking indicator of home sales based on contract signings – increased to 75.6 in February. Year over year, pending transactions were down 7.0%. An index of 100 is equal to the level of contract activity in 2001.
“While modest sales growth might not stir excitement, it shows slow and steady progress from the lows of late last year,” said NAR Chief Economist Lawrence Yun. “Ongoing job gains are clearly increasing demand along with more inventory.”
Pending Home Sales Regional Breakdown
The Northeast PHSI decreased 0.3% from last month to 63.4, a decline of 9.0% from February 2023. The Midwest index soared 10.6% to 81.6 in February, down 2.5% from one year ago.
The South PHSI rose 1.1% to 89.5 in February, falling 8.5% from the prior year. The West index fell 6.5% in February to 57.1, down 7.9% from February 2023.
“The high-cost regions in the Northeast and West experienced pullbacks due to affordability challenges,” added Yun. “Home prices rising faster than income growth is not healthy and adds challenges for first-time buyers.”
Yun further noted, “There will be a steady rise in inventory from recent growth in home building. Additionally, many sellers, who delayed listing in the past two years, will begin to put their homes on the market to move to a different home that better fits their new life circumstances – such as changes in family composition, jobs, commuting patterns and retirees wanting to be closer to their grandkids.”

Buyers must earn nearly twice as much as before the pandemic to afford the typical starter home, due to the one-two punch of high prices and mortgage rates. One sliver of hope: Affordability of starter homes is slowly improving after hitting a low point at the end of 2023.
Homebuyers must earn $75,849 annually to afford the typical U.S. starter home as of February, up 8.2% ($5,767) from a year earlier, according to a new report from Redfin (redfin.com), the technology-powered real estate brokerage. The monthly housing payment for the typical U.S. starter home was $1,896 in February, also up 8.2% from a year earlier.
The income necessary to buy starter homes is increasing from a year ago due to rising prices and mortgage rates: The typical starter home sold for $240,000 in February, up 3.4% year over year, and the average 30-year fixed mortgage rate was 6.78%, up from 6.26% a year earlier.
Starter homes are roughly half as affordable as they were before the pandemic. Americans needed to earn $40,465 annually to afford the typical U.S. starter home in February 2020, when the median sale price was $169,000 and the average mortgage rate was about 3.5%.
Americans earning the median U.S. income can still afford the typical starter home
Incomes are rising, but at less than half the rate of starter-home costs. The typical American household earns an estimated $84,072, up 5.5% from February 2023 (versus the 8.2% increase in income needed to buy a starter home). That means the typical household can afford the $75,849 median-priced starter home, but they have less money left over after housing payments than they used to.
Today, the median household income is just 11% higher than the income needed to buy a starter home. One year ago, the median household income was 14% higher than the income required to buy a starter home, and four years ago, just before the pandemic began, the median income was 63% higher.
Zooming out from starter homes to the overall market, a separate Redfin report found that a homebuyer must earn $114,000 to afford the typical U.S. home, roughly $30,000 more than the median U.S. household income.
It’s increasingly hard for lower-income families to buy a starter home
In the past, it was often true that people earning less than the median income could afford starter homes in much of the country; starter homes were considered an affordable option for first-time buyers.
Today, someone earning 80% of the median income—$67,258—could not afford the typical U.S. starter home. Before the pandemic real estate boom, someone earning 80% of the median income—roughly $53,000 in early 2020—could afford the typical starter home, which required an annual income of just over $40,000.
“The pandemic housing-market boom changed the definition of a starter home,” said Redfin Senior Economist Elijah de la Campa. “A decade ago, many people thought of a starter home as a small three-bedroom single-family house. Now that type of home could cost seven figures, especially in expensive parts of the country. The most affordable homes are much smaller and often require a lot of work to make them habitable—which makes them cost even more. Today’s most affordable homes are still hard for the average American to afford, let alone the average first-time buyer who tends to put less money down in exchange for higher monthly payments. Rising prices and mortgage rates are pushing buyers who earn more than the median income to buy starter homes, and often pushing buyers who earn less money out of the market.”
Another challenge for first-time buyers: They’re often competing with all-cash offers for limited inventory of starter homes. More than one-third (36.5%) of the nation’s starter homes were purchased in cash in February, near the highest level in a decade. It’s likely that many of those homes sold to real estate investors, who are turning them into rentals and thus removing them from the stock of for-sale starter homes. Others likely sold to repeat homebuyers using equity from a previous sale.
Starter homes are more affordable than they were last fall
While the income required to buy a starter home is up from a year ago, it’s down 8% ($6,524) from last October’s all-time high of $82,373. That’s because mortgage rates have come down from their recent high. Mortgage rates are sitting around 6.8%, down from a two-decade high of 7.8% in October 2023. Affordability should continue improving throughout 2024 as mortgage rates gradually decline further.
There are also a few other encouraging signs for first-time buyers:
- There are more starter homes to choose from. Active listings of starter homes rose 7% annually in February, the biggest increase in at least a decade. (The caveat is that the number of starter homes on the market fell to a record low in February 2023, which is part of the reason for the big year-over-year uptick.)
- In some metros, first-time buyers are able to negotiate prices down or get concessions from sellers because high costs are pushing down homebuying demand.
Metro-level* highlights: Starter homes, February 2024
*For the 50 most populous U.S. metros
- The income needed to afford a starter home is highest in California. A homebuyer needs to earn roughly $319,000 to buy the median-priced starter home in San Jose, $306,000 in San Francisco, and $247,000 in Anaheim.
- It’s lowest in the Rust Belt: Detroit ($22,000), Pittsburgh ($32,000) and St. Louis, MO ($37,000).
- The income needed to afford a starter home declined in just 1 metro area: Pittsburgh (-0.8% year over year to $32,000).
- It increased most in New Brunswick, NJ (17.5% to $126,000), Miami (16.7% to $104,000) and Montgomery County, PA (16% to $99,000).
To view the full report, including charts, tables and methodology, please visit: https://www.redfin.com/news/starter-home-affordability-february-2024

Agent Resource


From buying and selling advice for consumers to money-making tips for Agents, our content, updated daily, has made Realty Times® a must-read, and see, for anyone involved in Real Estate.