


When you talk options, be sure your clients know the true cost of their choices. I have had a number of conversations recently where my clients have won deals because they put the client in a position to succeed by sharing the true cost of their choices. We spoke a few months ago as we approached the end of the year and I suggested you drive the conversation around getting into a home prior to the beginning of the year, and the increase in demand that often creates. Some shared, others didn’t. Those that did are seeing their clients in homes that they secured at prices that are significantly lower than they would be right now, as well as the cost of that home a few more months from now. It’s simple, supply/demand is in favor of the seller. When sellers are in control, the cost to buy is higher and the competition is greater. As we approach the spring market, the demand will only grow higher, and so will prices. If we just use 5% appreciation rates, a $300K home costs $1,250 more in a month from now. A $400K house costs almost $1,700 more each month. How much has waiting cost someone that chose to wait from November until now? $5,000? $10,000? More?
The same case can be made for looking at the choices people have made when it comes to their outstanding debts. The largest overlook people make is the cost of that car they just had to buy! Maybe it’s the cost of two cars? But does the client realize the true cost of that choice? Do they know that at a 7% interest rate that every $100 in car payment reduces the amount of mortgage you can qualify for by more than $15,000? So, when we look at $500, $600, $700 a month or more in car payments, is that choice worth $75,000, $90,000, or over $100,000 in mortgage value? The same holds true for boats, RV’s, campers, credit cards, and other installment debt. Knowing the true cost can be life changing. Providing that information allows your client to understand their choices and how one choice can impact another. It also shows that as a true professional, you are sharing information that allows your client to make informed choices.
While people might not always make the best choices, they tend to make better choices when they are aware of all their options and how those choices impact other opportunities! As always, if you have questions or comments, it’sThis email address is being protected from spambots. You need JavaScript enabled to view it.
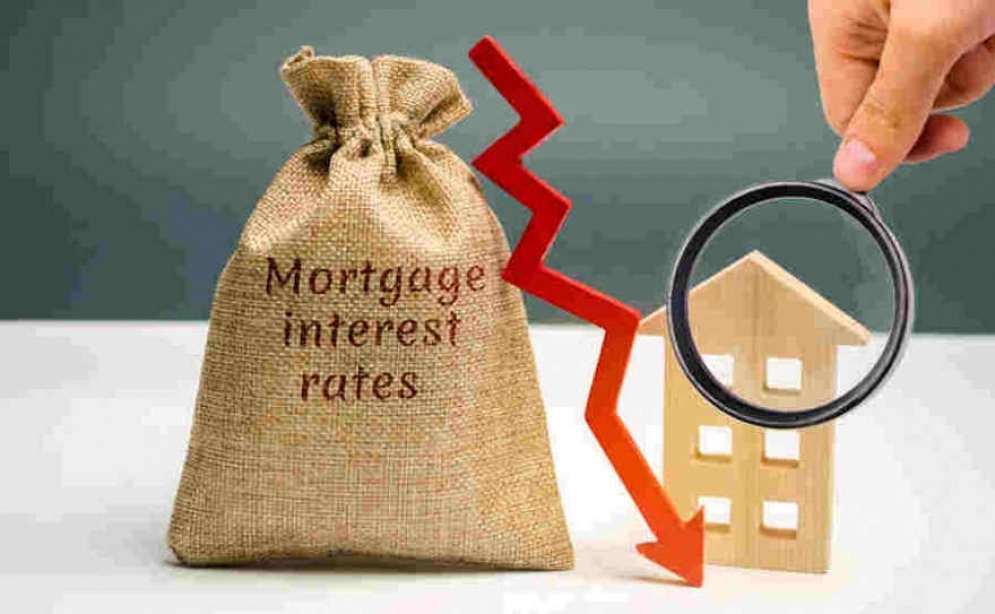
Freddie Mac (OTCQB: FMCC) today released the results of its Primary Mortgage Market Survey® (PMMS®), showing the 30-year fixed-rate mortgage (FRM) averaged 6.88 percent.
“Evidence that purchase demand remains sensitive to interest rate changes was on display this week, as applications rose for the first time in six weeks in response to lower rates,” said Sam Khater, Freddie Mac’s Chief Economist. “Mortgage rates continue to be one of the biggest hurdles for potential homebuyers looking to enter the market. It’s important to remember that rates can vary widely between mortgage lenders so shopping around is essential.”
News Facts
- The 30-year FRM averaged 6.88 percent as of March 7, 2024, down from last week when it averaged 6.94 percent. A year ago at this time, the 30-year FRM averaged 6.73 percent.
- The 15-year FRM averaged 6.22 percent, down from last week when it averaged 6.26 percent. A year ago at this time, the 15-year FRM averaged 5.95 percent.
The PMMS® is focused on conventional, conforming, fully amortizing home purchase loans for borrowers who put 20 percent down and have excellent credit. For more information, view our Frequently Asked Questions.
Freddie Mac’s mission is to make home possible for families across the nation. We promote liquidity, stability, affordability and equity in the housing market throughout all economic cycles. Since 1970, we have helped tens of millions of families buy, rent or keep their home. Learn More: Website
![54% of Mortgage Offers Went to Millennial Homebuyers in 2023 [New LendingTree Report]](/media/k2/items/cache/18af2cf0b3ad0526d3a94c161a7568f6_M.jpg)
Though it may sometimes seem as if millennials are destined to rent or live in their parents’ basements forever, members of the generation are among the most influential in the housing market.
To highlight where millennials are looking to buy, LendingTree analyzed mortgage offers given to users of our online shopping platform across the nation’s 50 largest metropolitan areas in 2023. We found that millennials received at least 50% of mortgage offers made in most of the country’s largest metros. Here's what else we found.
- Across the nation’s 50 largest metros, 53.85% of mortgage offers in 2023 went to millennials. Millennials received more than 50% of all offered mortgages in 35 of the nation’s 50 largest metros.
- Millennials made up the largest share of potential homebuyers in San Jose, Calif., San Francisco and Boston. In San Jose, 64.75% of mortgages in 2023 were offered to millennials.
- Millennials in Las Vegas, Phoenix and Tampa, Fla., made up the smallest share of potential buyers — though still substantial. In Las Vegas, 40.76% of mortgage offers in 2023 went to millennials.
- Offered loan amounts were largest in San Jose, San Francisco and Los Angeles. Loan amounts in these three metros in 2023 were $785,391, $731,062 and $627,322, respectively. Conversely, at $242,220, $268,484 and $268,900, average loan amounts offered in Buffalo, N.Y., Cleveland and Louisville, Ky., were the smallest.
-
You can check out our full report here: https://www.lendingtree.com/home/mortgage/most-popular-cities-millennial-homebuyers/
LendingTree's Senior Economist and report author, Jacob Channel, had this to say:
"Even though they typically aren’t as financially well off as members of older generations are, this doesn’t mean that most millennials are destitute. On the contrary, despite the very real economic challenges that many members of the generation have to face, millennials are still making significant financial headway in various arenas, including homeownership."

Cyber attacks have been an ongoing challenge for individuals and businesses over the years. Previously, they manifested through emails, Trojan horses, and various forms of malware that, upon infiltrating your computer via the internet, replicated themselves and replaced code within functional programs. Today, this threat continues to persist, posing a constant danger to both individuals and businesses.
But as digital technology has evolved at unprecedented rates, so too have cyber attacks and their complexities. Recently, I discussed how Ransomware has impacted many industries — most recently, the manufacturing industry. Ransomware attacks are a Hard Trend that is not slowing down anytime soon, as cyber criminals infiltrate organizational software and lock away vital information the company requires to operate.
Frankly, it is unfortunate that when these cyber criminals demand compensation, or ransom, to return the information, including sensitive customer and client information as well as valuable data, many organizations simply buckle and pay without ever fixing the problem.
And as a result, yet another attack is sure to follow. Soon, the organization is a crisis manager that never actually manages the crisis!
Ransomware attacks cost organizations millions of dollars, but worse, they reduce client trust in the organization — valuable equity in the longevity of an organization that far outmatches simple cash-in and cash-out. Suddenly, future profits are at risk as much as current profits!
I want those future gains to be bountiful for you, your team, and your organization as a whole. And without question, I know that the best defense in cybersecurity and Ransomware is an effective offense, all of which stems from proactivity and a well-developed sense of anticipation that complements an Anticipatory mindset!
Persistent Cybersecurity Threats to Stay Vigilant Against Today
Now, you may be thinking, “A cyberattack could never happen to my business. We are too small of a business to be of interest to cyber criminals.” Or perhaps you are comfortable with the status quo, thinking, “Our current IT system has protected us for years and will continue to do so.”
That way of thinking will quickly cause a downfall in this digitally transformative world! Focusing on what has happened previously instead of looking to the future on where Ransomware is headed is dangerous.
This would be like a sports team believing that their strategy from years ago could still win a championship against a team that has a strategy for today’s game. We all know what the result of this would be.
Cyber threats intrude on every industry and have been increasing at unprecedented rates since 2020, when Ransomware started making headlines. Now that there is less of a focus on Ransomware, many are tabling the threat and moving on.
Let me present you with a few current statistics according to a 2023 study completed by cyber insurance company Corvus Insurance:
• Ransomware attacks are up 95% since 2022
• Attacks on law practices are up 70%
• Threats to government agencies increased by 95% through 2023
• There is a 60% uptick in Ransomware attacks against the manufacturing industry
• Ransomware attacks are up 142% in the oil and gas industries
• 50% of transportation and logistics companies reported attacks
If these trends continue, and trust me when I say that you can count on this as a Hard Trend, there will likely be an attack every two seconds by the year 2031!
The focus may be on lost monetary funds; however, these threats are far more debilitating. In March of 2023, the Minneapolis Public School District was hit by the hacker group Medusa, who leaked over 300,000 confidential files of employees and students. Additionally, Lehigh Valley Health Network was hacked and is facing multiple lawsuits due to the loss of sensitive patient data that violated HIPAA laws.
In those cases, trust was breached and negatively impacted the future progress of these organizations.
Cyber criminals utilizing the advancement of technology to their advantage is just as much of a Hard Trend as those leveraging it for the good of their organization and industry. However, allowing these cyber criminals to do this is a Soft Trend. We can change the course of this!
Exponential Thinking Can Improve Cybersecurity
Because no industry is safe, it is no longer acceptable to sit back and let our IT departments operate as they always have. To keep employees, clients, and valuable data safe, it is paramount that we look to the future to anticipate the disruption that cyber crime and various Ransomware attacks will become and plan ahead before it ever has the opportunity to disrupt and destroy your future gains!
There may be no way to foresee exactly when a cyber attack will threaten your organization, but with my Anticipatory Leader System, the goal is to pre-solve any problems that may lead to a Ransomware attack or other cyber threat! We want to be prepared for when it inevitably happens so we are not trying to implement agility in the wake of an attack after the fact.
Because I encourage exponential thinking with regard to disruptive digital technology, I want you to use this same level of cognition regarding Ransomware and cyber threats.
For example, Artificial Intelligence (AI) has been around for years but came to the mainstream with the introduction of ChatGPT in late 2022. Now, there are countless other AI applications out there, and cyber criminals are already using this technology to write virus-ridden code and streamline cyber attacks on various industries.
You cannot stop these individuals from utilizing AI for bad, but likewise, they cannot stop you from utilizing it to do good! Ask yourself:
• How can you also use AI to improve your cybersecurity?
• Can you leverage it to find holes in your system and create a better defense net?
• Can you implement AI or hire an organization to implement it as a way to outsmart any tech trying to breach a firewall?
Of course you can! It is just about finding the right application and the right team, and beginning with an Anticipatory mindset.

More sellers are listing their homes, but 7% mortgage rates and still-high home prices are pushing down sales
New listings of U.S. homes for sale rose 13% year over year during the four weeks ending February 25, the biggest increase in nearly three years, according to a new report from Redfin (redfin.com), the technology-powered real estate brokerage. Total inventory is also improving: Active listings are flat from a year ago, marking the first time in nine months the total number of homes for sale hasn’t declined.
That’s welcome news for homebuyers, who have been battling the dual challenges of low inventory and high mortgage rates for over a year. But while today’s buyers have a few more homes to choose from, they’re still facing historically high housing costs. The typical homebuyer’s mortgage payment is $2,671, just $47 shy of last October’s record high.
High costs pushed pending sales down 8%, the biggest decline in five months, and mortgage-purchase applications declined for the fourth straight week. But more house hunters are searching as more homes hit the market. Redfin’s Homebuyer Demand Index–a measure of requests for tours and other services from Redfin agents–is up 10% from a month ago to its highest level since last September. Pending sales could improve in the next few months if rates don’t increase further and new listings continue to rise.
“House hunters are out there, and competition picks up every time mortgage rates decline a bit,” said Brynn Rea, a Redfin Premier agent in Spokane, WA. “I’m telling buyers who can afford it to look now while they have more breathing room and less competition. They have a good chance of negotiating the price down or getting some concessions from the seller, which could make up for getting a 7% mortgage rate instead of 6%.”
Leading indicators
|
Indicators of homebuying demand and activity |
||||
|
Value (if applicable) |
Recent change |
Year-over-year change |
Source |
|
|
Daily average 30-year fixed mortgage rate |
7.15% (Feb. 28) |
Up from 6.92% a month earlier |
Up from 6.78% |
Mortgage News Daily |
|
Weekly average 30-year fixed mortgage rate |
6.9% (week ending Feb. 22) |
Up from 6.77% a week earlier |
Up from 6.5% |
Freddie Mac |
|
Mortgage-purchase applications (seasonally adjusted) |
Down 5% from a week earlier (as of week ending Feb. 23) |
Down 12% |
Mortgage Bankers Association |
|
|
Redfin Homebuyer Demand Index (seasonally adjusted) |
Up 8% from a week earlier; up 10% from a month earlier (as of week ending Feb. 25) |
Down 9% |
Redfin Homebuyer Demand Index, a measure of requests for tours and other homebuying services from Redfin agents |
|
|
Google searches for “home for sale” |
Up 7% from a month earlier (as of Feb. 24) |
Down 8% |
Google Trends |
|
|
Touring activity |
Up 12% from the start of the year (as of Feb. 25) |
At this time last year, it was up 14% from the start of 2023 |
ShowingTime, a home touring technology company |
|
Key housing-market data
|
U.S. highlights: Four weeks ending February 25, 2024 Redfin’s national metrics include data from 400+ U.S. metro areas, and is based on homes listed and/or sold during the period. Weekly housing-market data goes back through 2015. Subject to revision. |
|||
|
Four weeks ending February 25, 2024 |
Year-over-year change |
Notes |
|
|
Median sale price |
$365,888 |
5.4% |
Biggest increase since Oct. 2022 (with the exception of the 4 weeks ending Feb. 11, when there was a 5.5% increase) |
|
Median asking price |
$396,975 |
5.5% |
|
|
Median monthly mortgage payment |
$2,671 at a 6.9% mortgage rate |
7.7% |
Down less than $50 from all-time high set in October 2023 |
|
Pending sales |
75,947 |
-7.7% |
Biggest decline since Oct. 2022 |
|
New listings |
79,354 |
12.9% |
Biggest increase since June 2021 |
|
Active listings |
763,254 |
Unchanged |
First time active listings haven’t posted a YoY decline since June 2023 |
|
Months of supply |
3.9 months |
+0.2 pts. |
4 to 5 months of supply is considered balanced, with a lower number indicating seller’s market conditions |
|
Share of homes off market in two weeks |
37.9% |
Up from 36% |
|
|
Median days on market |
48 |
-3 days |
|
|
Share of homes sold above list price |
23.6% |
Up from 22% |
|
|
Share of homes with a price drop |
5.8% |
+1.6 pts. |
|
|
Average sale-to-list price ratio |
98.4% |
+0.4 pts. |
|
|
Metro-level highlights: Four weeks ending February 25, 2024 Redfin’s metro-level data includes the 50 most populous U.S. metros. Select metros may be excluded from time to time to ensure data accuracy. |
|||
|
Metros with biggest year-over-year increases |
Metros with biggest year-over-year decreases |
Notes |
|
|
Median sale price |
Newark, NJ (15.5%) San Diego, CA (15.3%) Montgomery County, PA (14.5%) Pittsburgh (13.9%) Anaheim, CA (13.5%) |
San Antonio, TX (-5%) Detroit (-0.4%) |
Declined in 2 metros |
|
Pending sales |
Austin, TX (5.7%) Milwaukee (3.7%) Minneapolis (2.6%) Cleveland (1.2%) Pittsburgh (0.6%) Cincinnati (0.6%) |
San Antonio, TX (-29.8%) New Brunswick, NJ (-19.4%) Warren, MI (-18.3%) Atlanta (-16%) Houston (-15.6%) |
Increased in 6 metros |
|
New listings |
Dallas (35.5%) Jacksonville, FL (34.3%) Austin, TX (31.6%) Fort Worth, TX (29.8%) Miami (25.7%) |
Atlanta (-5.8%) Newark, NJ (-5.4%) Milwaukee (-4.6%) Providence, RI (-4.3%) Chicago (-1.5%) Warren, MI (-0.9%) |
Declined in 6 metros |
To view the full report, including charts, please visit:
https://www.redfin.com/news/housing-market-update-new-listings-increase-pending-sales-decline/

Meet Tim Holmes, creator of Nurkl Toys, who is on a mission to help kids stay creative! In his recent video, Tim showcases how sticks can be transformed into endless possibilities for kids to enjoy. Check out the video!

Freddie Mac (OTCQB: FMCC) today released the results of its Primary Mortgage Market Survey® (PMMS®), showing the 30-year fixed-rate mortgage (FRM) averaged 6.94 percent.
"Mortgage rates continued their ascent this week, reaching a two-month high and flirting with seven percent yet again,” said Sam Khater, Freddie Mac’s Chief Economist. “The recent boomerang in rates has dampened already tentative homebuyer momentum as we approach the spring, a historically busy season for homebuying. While sales of newly built homes are trending in a positive direction, higher rates and elevated prices continue to pose affordability challenges that may leave potential homebuyers on the sidelines.”
News Facts
- The 30-year FRM averaged 6.94 percent as of February 29, 2024, up from last week when it averaged 6.90 percent. A year ago at this time, the 30-year FRM averaged 6.65 percent.
- The 15-year FRM averaged 6.26 percent, down from last week when it averaged 6.29 percent. A year ago at this time, the 15-year FRM averaged 5.89 percent.
The PMMS® is focused on conventional, conforming, fully amortizing home purchase loans for borrowers who put 20 percent down and have excellent credit. For more information, view our Frequently Asked Questions.
Freddie Mac’s mission is to make home possible for families across the nation. We promote liquidity, stability, affordability and equity in the housing market throughout all economic cycles. Since 1970, we have helped tens of millions of families buy, rent or keep their home. Learn More: Website

You only have two options when it comes to the future of technology in marketing:
First, which is unfortunately appealing to many, you can hunker down, sticking to the old marketing tactics to drive sales. In doing so, you decide to let others deal with advancements in digital technology while you sit on the sidelines and see what happens. This strategy seems safe because others are taking the risks, not you.
But the issue here is that simultaneously, your competition and their marketing team is taking calculated risks based on Hard Trend future certainties, and while doing so, they are also reaping the benefits and advancing into the future. Not only will your brand sit idly by, but your sales will stagnate.
But of course, there is a second option. This option is much more beneficial to your bottom line and is the key to being the disruptor instead of the disrupted.
Instead of letting others take a risk that seems dangerous, look at the future of marketing with an Anticipatory mindset and think critically about how new technologies can advance marketing strategy and, thus, drive sales in exponential ways with exponential thinking about those future certainties!
The Future Is Predictable — Something Marketers Must See
Our world is full of uncertainty regardless of how you view the future. Shifting to an Anticipatory mindset is not about stopping the unknown from heading our way — it is about leveraging the countless things that we can be certain about.
And for those in marketing, today’s world of digital transformation means staying ahead of technological advancements and learning to leverage them now. This is far more crucial than most realize, allowing those who work in marketing to help their organization avoid disruption to their business model and, most importantly, sales.
Technology is changing at an exponential rate, especially with the influx of Artificial Intelligence (AI) like ChatGPT and AdCreative.ai. But when you have the certainty that you know where customer expectations and preferences are headed as well as what the next technological advancement will be, you can leverage that information to pre-solve problems before they occur.
In this case, marketers already know that AI and the applications involved will continue to grow. With that Hard Trend future certainty, you can have the confidence to make better decisions with your marketing efforts and how to leverage it to your advantage.
Speeding Up the Process
If we were to focus on the advancement of AI applications and their role in the marketing industry, one in the industry may still balk at a thought.
It all goes back to the fear of being displaced, right? Because a “computer can do it,” somehow a marketing professional becomes unnecessary or, worse, we start losing pay because our duties are getting simpler.
I want all those who work in marketing to understand that AI applications like ChatGPT, AdCreative.ai, and the like are not here to replace your job. Will AI get more efficient and digitally more intelligent and progress beyond the stage that it is currently sitting at now? Absolutely! But you have the power to grow with it, leverage it now, and be ahead of the curve in how it improves your marketing efforts, whether you work for an organization or work for a marketing company.
ChatGPT is like a wrench to a plumber. The plumber does not need to loosen bolts with their bare hands — they use a wrench to get the job done faster and more efficiently. Some bolts would be impossible to loosen without a wrench!
The same principle applies here. ChatGPT and other content creation software is a tool for the marketing industry.
Be an Exponential Thinker as an Anticipatory Marketer
What this all goes back to is the concept of exponential thinking, just as I teach in my Anticipatory Leader System.
Exponential thinking very much involves recognizing a Hard Trend future certainty and adapting it to your advantage, seeing the different ways it can help develop your business or organization.
Aside from evolving with the times as a marketing professional working alongside AI as it grows, you should also think exponentially about it. How can the different AI applications applied to the marketing and advertising process be used to tell the story of your brand in ways you never thought of before? Can AI applications speed up the content creation process? Will it help you reignite that creative spark that some struggle with on a Monday morning?
Marketers and advertising professionals are artists at heart. And much like a musician with a piano, the tool of AI provides boundless creative opportunities to be innovative in exponential ways. The piano only has 88 keys, the guitar only has so many strings, and a singer has one voice. But the way in which human beings use those instruments exponentially makes for thousands of new songs every day around the world.
You have the Hard Trend in your hands. Now it needs to be adapted to you and your team, rather than you adapting to the technology. You are the artist, so take control with certainty!
![64% of Homebuyers/Sellers Have Successfully Negotiated Real Estate Agent Fees [New LendingTree Report]](/media/k2/items/cache/a469d7f069dcee0a43dc46583431ed5f_S.jpg)
Lending Tree's latest survey found that nearly two-thirds of homebuyers or sellers who asked their real estate agent for a lower commission fee were successful. Here's what else they found.
- While just 31% of homebuyers or sellers have attempted to negotiate real estate agent commission fees when buying or selling, 64% of those who asked successfully reduced theirs. Additionally, 36% say they weren’t aware negotiating was an option but would have tried if they were. Overall, 84% of Americans believe real estate agents should be flexible with their commission.
- Among homebuyers or sellers, 48% admit they don’t know what percent commission their agent received in their last transaction. 44% of those who do know say their agent received between 3.00% to 4.99% in their last transaction, while 30% say it was 5.00% or higher.
- 64% of Americans believe a real estate agent is at least somewhat necessary when buying or selling. However, 44% say they would attempt a real estate transaction without an agent. When asked if they think online tools and services have made agents less necessary in transactions, 64% agreed.
- 11% of Americans said the buyer should be responsible for the entire commission, and 20% said the seller. Over a third (35%) of homebuyers or sellers say they’ve been asked to pay the other party’s real estate agent fees in a transaction — more commonly the buyer than the seller.
You can check out our full report here: https://www.lendingtree.com/home/mortgage/real-estate-survey/
LendingTree's Senior Economist and report author, Jacob Channel, had this to say.
"Remember, real estate agent fees aren’t necessarily set in stone. While most home buyers and sellers don’t attempt to negotiate fees, a majority of those who do have gotten their fees lowered. This goes to show how important it is to advocate for yourself during all stages of the homebuying/selling process. If you don’t ask for a better deal, you’re unlikely to get one."

Florida’s condo market is faltering as the increasing intensity of natural disasters pushes up home insurance costs, and HOA fees soar in the wake of the 2021 Surfside condo collapse
Prices of condos in major Florida metros are dropping year over year, and sales are declining, according to a new report from Redfin (redfin.com), the technology-powered real estate brokerage. New condo listings are soaring as sellers try to offload their properties. That differs from the U.S. as a whole, where condo prices are rising, sales are holding steady and new listings are increasing at a much slower rate.
In the Jacksonville metro, for instance, the median condo price declined roughly 7% year over year in January, sales declined 27%, and new listings increased 32%. The story is similar in Miami, where condo prices fell 3%, sales dropped 9% and new listings rose 27%.
Florida’s market for single-family homes is faring better. Take Miami as an example: The median sale price of single-family homes increased by double digits from a year earlier in January, sales rose 9% and new listings increased 13%.
Florida Redfin agents say climbing costs are making condo ownership unattractive
Redfin agents report that Florida’s condo sales are slow because the cost of buying a condo has shot up, and listings are skyrocketing because the cost of owning a condo has shot up. The average cost of homeowners insurance across Florida increased by about 40% in 2023 alone, according to reports, and homeowners association (HOA) fees are multiplying for many condo buildings. In addition to slowing demand, the rising cost of insurance and fees are pushing prices down.
While condo prices are down from a year ago, they’re still much higher than they were before the pandemic—an affordability challenge that’s being exacerbated by rising insurance and HOA expenses.
“Condo costs are shocking,” said Juan Castro, a Redfin Premier agent in Orlando. “Condos that used to have a $400 monthly maintenance fee may now have a $700 fee. It’s causing buyers to rethink their plans.”
Florida’s HOA fees are increasing because there are new condo regulations in place this year in the wake of the 2021 Surfside condo collapse. The regulations require HOAs to regularly assess the safety of condo buildings, and in many cases collect more money for maintenance and repairs. HOA fees typically include a condo owner’s portion of insurance costs for the exterior of a building, while homeowners have a separate policy covering the interior of their condo.
In some situations, it’s also more difficult to attain a condo mortgage than a single-family home mortgage, even though condos are often considered a more affordable option. That’s because lenders require borrowers to have enough money to cover HOA dues, and also take into consideration the financial health of the condo building before writing a loan.
Home insurance costs are skyrocketing in Florida due to the increasing intensity of hurricanes and other natural disasters, with some insurance companies leaving the state altogether. Homeowners’ insurance costs three times more in Florida than the national average, making it the most expensive state in the U.S. to insure a home.
“Condos are sitting on the market much longer than they used to, with less interest from buyers,” said Jacksonville Redfin Premier agent Heather Kruayai. “Sky-high HOA costs are pushing buyers out of their monthly budget.”
To read the full report, complete with a table that includes more data, please visit: https://www.redfin.com/news/florida-condo-prices-dropping/
More...

As mortgage professionals, we must deal with many things in our day-to-day business. Some of these things are controllable, some are not. One of the issues that we all have to deal with is market volatility. When the market moves, it can create a great deal of stress for us, our team, our referral partners, and of course, our clients. Interest rates can be a very emotional subject. People hate paying more, but also, fear things they don’t understand. So here are a few things we can look at to help ourselves, as well as our clients and referral partners, be aware of that may cause movement in the rate markets.
• FED Meetings – ten times a year and they set the market for short term bank rates. They don’t have to raise or lower rates to impact the market, it can just be what they say they intend to do!
• CPI – Consumer Price Index. Tracks inflation on typical consumer items. Inflation goes higher, rates go higher! Inflation goes lower, rates tend to follow! Once a month tracking the prior month.
• PPI – Producer Price Index. Same as CPI but tracks costs at the wholesale level. Not as important as CPI because producer prices don’t always increase prices to the consumer.
• Initial and Continuing Jobless Claims – Every Thursday (except holidays) we see these numbers. Higher claims mean the economy is getting worse, could push rates lower. Lower claims show the economy getting stronger and may push rates higher.
• World Events – Stuff happens! War, Weather, political changes, or shifts in policy can often impact rates here in the US.
• Lending Guidelines, Products, and Programs. At any point, the rules by which mortgage lending is regulated can change. From the federal level, down to state and local regulations. Sometimes without much warning, the rules can change, and rates will follow.
This isn’t everything that can move the markets, but just the ones I track on a regular basis and suggest for my clients to stay aware of. You can’t just trust the internet or social media posts to explain to you what is happening and why; it’s important that you know! If you have questions or comments, please let me know: This email address is being protected from spambots. You need JavaScript enabled to view it.

Home prices rose 0.5% month over month in January, on par with December’s gain, as the drop in mortgage rates at the end of last year gave buyers a bit more purchasing power
U.S. home prices climbed 0.5% from a month earlier in January, matching the 0.5% gain seen in both December and November, according to a new report from Redfin (redfin.com), the technology-powered real estate brokerage. On a year-over-year basis, prices rose 6.7%—the largest increase in a year.
This is according to the January Redfin Home Price Index (RHPI), covering the three months ending Jan. 31, 2024. Read the full RHPI methodology here.
“Price growth held steady last month because many of the home purchases that closed in January were negotiated at the end of last year, when mortgage rates posted the biggest drop since 2008. The decline in rates gave buyers more purchasing power, and for some, a sense of urgency to lock in a mortgage,” said Redfin Senior Economist Sheharyar Bokhari. “Prices also climbed because there’s still a shortage of homes for sale, which is fueling competition in some areas.”
New listings fell 1.2% month over month on a seasonally adjusted basis in January, the first drop since June, and remained far below pre-pandemic levels—contributing to the increase in prices. Listings are declining largely because many homeowners are hesitant to give up their rock-bottom mortgage rates; a majority of homeowners still have rates below current levels.
Prices Climbed Most in Montgomery County, Fell Fastest in Charlotte
In Montgomery County, PA, home prices rose 3.7% from a month earlier in January—the biggest increase among the 50 most populous U.S. metropolitan areas. Next came Philadelphia (1.9%), Baltimore (1.9%), Cleveland (1.7%) and New York (1.6%).
Thirteen metros saw price declines. In Charlotte, NC, home prices dropped 0.7% month over month—the largest decrease among the 50 most populous metros. It was followed by San Francisco (-0.6%), Austin, TX (-0.6%), San Diego (-0.5%) and Sacramento, CA (-0.4%).
To view the full report, including charts, please visit:
https://www.redfin.com/news/redfin-home-price-index-january-2024

More than forty years being associated inside the mortgage and real estate communities has taught me a great deal. Working with some of the best professionals in these areas across the country can also remind me that the more things change, the more they stay the same. I have preached here before the value of situational awareness and that the true value of any professional is providing options for their clients and sharing multiple ways of getting things done. A recent conversation with one of my clients brought back the exact same scenario I had with a client more than 30 years ago and helped me understand very deeply about how much value we can bring to the table if we just look at all the details and provide objective options!
Quite simply, the story goes like this; a couple want to sell a house and buy another one that suits their needs much better for the next stage of their lives. Having a current home that has amassed a huge amount of equity, the couple goes to an agent who starts to show them houses that fit their new objectives. They see a number of homes and locations that would work well, and then go home and start searching the internet for solutions. UGH!!!
They discover that even with putting all of their equity down on the new house, the new payments would be far too high for them and assume that their dream is dead. When their agent calls to follow up, the clients share the story, and the agent suggests that they speak to my client to discuss their options. Still holding the desire to make their move, they reach out to my client for a conversation. After looking at ALL THE NUMBERS, it became obvious that their equity would be best used to eliminate outstanding debt, thus reducing their total monthly payments. This meant that they could get the house and location they dreamed about, but also REDUCE their total monthly financial obligations by a large amount! They listed and sold their current home, paid off their debt, bought the house they loved, and reduced their total monthly obligations!
These people would never have known what they were capable of doing if not for skilled professionals providing all their options. You must establish that value if you are going to compete against the internet and social media! Differentiation matters! Questions or comments: This email address is being protected from spambots. You need JavaScript enabled to view it.
![Existing-Home Sales Rose 3.1% in January [NAR]](/media/k2/items/cache/d2af3a14b3e10d7ed9eb1f44e27b82d5_XS.jpg)
– Existing-home sales grew in January, according to the National Association of Realtors®. Among the four major U.S. regions, sales accelerated in the Midwest, South and West, and remained steady in the Northeast. Year-over-year, sales improved in the West, and decreased in the Northeast, Midwest and South.
Total existing-home sales[i] – completed transactions that include single-family homes, townhomes, condominiums and co-ops – elevated 3.1% from December to a seasonally adjusted annual rate of 4.00 million in January. Year-over-year, sales slipped 1.7% (down from 4.07 million in January 2023).
“While home sales remain sizably lower than a couple of years ago, January’s monthly gain is the start of more supply and demand,” said NAR Chief Economist Lawrence Yun. “Listings were modestly higher, and home buyers are taking advantage of lower mortgage rates compared to late last year.”
Total housing inventory[ii] registered at the end of January was 1.01 million units, up 2.0% from December and 3.1% from one year ago (980,000). Unsold inventory sits at a 3.0-month supply at the current sales pace, down from 3.1 months in December but up from 2.9 months in January 2023.
The median existing-home price[iii] for all housing types in January was $379,100, an increase of 5.1% from one year ago ($360,800). All four U.S. regions posted price increases.
“The median home price reached an all-time high for the month of January,” Yun added. “Multiple offers are common on mid-priced homes, and many homes were still sold within a month. The elevated share of cash deals – 32% – indicated a market full of multiple offers and propelled by record-high housing wealth.”
REALTORS® Confidence Index
According to the monthly REALTORS® Confidence Index, properties typically remained on the market for 36 days in January, up from 29 days in December and 33 days in January 2023.
First-time buyers were responsible for 28% of sales in January, down from 29% in December and 31% in January 2023. NAR’s 2023 Profile of Home Buyers and Sellers – released in November 2023[iv] – found that the annual share of first-time buyers was 32%.
All-cash sales accounted for 32% of transactions in January, up from 29% in both December and one year ago.
Individual investors or second-home buyers, who make up many cash sales, purchased 17% of homes in January, up from 16% in December and January 2023.
Distressed sales[v] – foreclosures and short sales – represented 2% of sales in January, virtually unchanged from last month and the previous year.
Mortgage Rates
According to Freddie Mac, the 30-year fixed-rate mortgage averaged 6.77% as of February 15. That’s up from 6.64% the previous week and 6.32% one year ago.
Single-family and Condo/Co-op Sales
Single-family home sales moved higher to a seasonally adjusted annual rate of 3.6 million in January, up 3.4% from 3.48 million in December but down 1.4% from the prior year. The median existing single-family home price was $383,500 in January, up 5.0% from January 2023.
At a seasonally adjusted annual rate of 400,000 units in January, existing condominium and co-op sales were unchanged from last month and down 4.8% from one year ago (420,000 units). The median existing condo price was $339,400 in January, up 5.7% from the previous year ($321,100).
Regional Breakdown
At 480,000 units, existing-home sales in the Northeast were unchanged from December but down 5.9% from January 2023. The median price in the Northeast was $434,300, up 10.1% from the prior year.
In the Midwest, existing-home sales increased 2.2% from one month ago to an annual rate of 950,000 in January, down 3.1% from last year. The median price in the Midwest was $271,700, up 7.6% from January 2023.
Existing-home sales in the South rose 4.0% from December to an annual rate of 1.84 million in January, a decline of 1.6% from the previous year. The median price in the South was $345,100, up 4.1% from one year ago.
In the West, existing-home sales elevated 4.3% from a month ago to an annual rate of 730,000 in January and grew 2.8% from one year earlier. The median price in the West was $572,100, up 6.3% from January 2023.
“More listings will help Americans move,” said NAR President Kevin Sears, broker-partner of Sears Real Estate in Springfield, Massachusetts. “That’s why NAR has pushed for the passage of H.R. 1321 – The More Homes on the Market Act – which would lower the tax hit on home sales and bring additional inventory to the market.”
[i] Existing-home sales, which include single-family, townhomes, condominiums and co-ops, are based on transaction closings from Multiple Listing Services. Changes in sales trends outside of MLSs are not captured in the monthly series. NAR benchmarks home sales periodically using other sources to assess overall home sales trends, including sales not reported by MLSs.
Existing-home sales, based on closings, differ from the U.S. Census Bureau’s series on new single-family home sales, which are based on contracts or the acceptance of a deposit. Because of these differences, it is not uncommon for each series to move in different directions in the same month. In addition, existing-home sales, which account for more than 90% of total home sales, are based on a much larger data sample – about 40% of multiple listing service data each month – and typically are not subject to large prior-month revisions.
The annual rate for a particular month represents what the total number of actual sales for a year would be if the relative pace for that month were maintained for 12 consecutive months. Seasonally adjusted annual rates are used in reporting monthly data to factor out seasonal variations in resale activity. For example, home sales volume is normally higher in the summer than in the winter, primarily because of differences in the weather and family buying patterns. However, seasonal factors cannot compensate for abnormal weather patterns.
Single-family data collection began monthly in 1968, while condo data collection began quarterly in 1981; the series were combined in 1999 when monthly collection of condo data began. Prior to this period, single-family homes accounted for more than nine out of 10 purchases. Historic comparisons for total home sales prior to 1999 are based on monthly single-family sales, combined with the corresponding quarterly sales rate for condos.
[ii] Total inventory and month’s supply data are available back through 1999, while single-family inventory and month’s supply are available back to 1982 (prior to 1999, single-family sales accounted for more than 90% of transactions and condos were measured only on a quarterly basis).
[iii] The median price is where half sold for more and half sold for less; medians are more typical of market conditions than average prices, which are skewed higher by a relatively small share of upper-end transactions. The only valid comparisons for median prices are with the same period a year earlier due to seasonality in buying patterns. Month-to-month comparisons do not compensate for seasonal changes, especially for the timing of family buying patterns. Changes in the composition of sales can distort median price data. Year-ago median and mean prices sometimes are revised in an automated process if additional data is received.
The national median condo/co-op price often is higher than the median single-family home price because condos are concentrated in higher-cost housing markets. However, in a given area, single-family homes typically sell for more than condos as seen in NAR’s quarterly metro area price reports.
[iv] Survey results represent owner-occupants and differ from separately reported monthly findings from NAR’s REALTORS® Confidence Index, which include all types of buyers. The annual study only represents primary residence purchases, and does not include investor and vacation home buyers. Results include both new and existing homes.
[v] Distressed sales (foreclosures and short sales), days on market, first-time buyers, all-cash transactions and investors are from a monthly survey for the NAR’s REALTORS® Confidence Index, posted at nar.realtor.
Agent Resource

From buying and selling advice for consumers to money-making tips for Agents, our content, updated daily, has made Realty Times® a must-read, and see, for anyone involved in Real Estate.